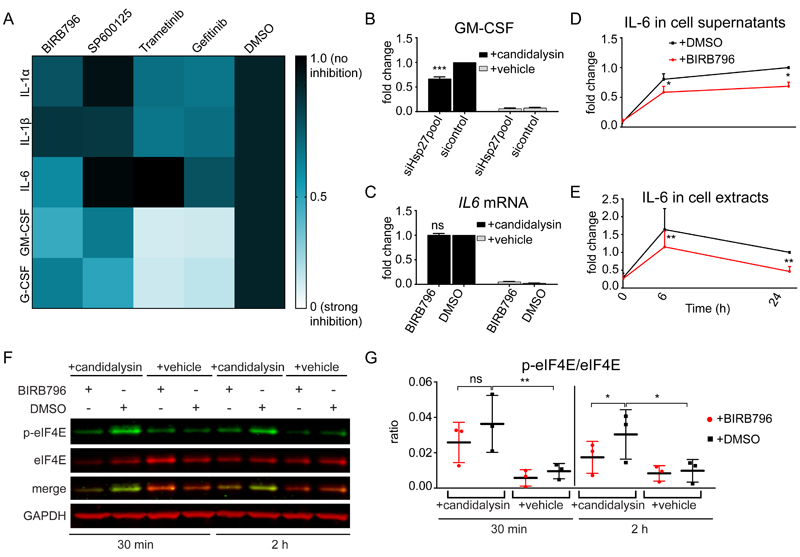
Fig. 2. p38 and ERK1/2 trigger distinct patterns of cytokine release.
A, Heatmap of the release of IL-1α, IL-1β, IL-6, GM-CSF, and G-CSF by TR146 OECs at 24 h post-candidalysin stimulation in the presence of BIRB796, SP600125, Trametinib, or Gefitinib. The heatmap was generated from the data in fig. S2A. B, Release of GM-CSF from TR146 cells transfected with a pool of Hsp27-targeted siRNAs 72 h prior to candidalysin stimulation for 24 h. Graph shows means of three biological replicates + SD and is expressed as fold change relative to siRNA control + candidalysin. C, Relative expression of IL6 6 h post-candidalysin stimulation in the presence of BIRB796. Graph shows means of three biological replicates + SD and is expressed as fold change relative to DMSO + candidalysin. D and E, IL-6 released into the supernatant D, and present in cell extracts E, before (0 h), after 6 h and after 24 h of candidalysin treatment with or without BIRB796. Graphs show means of three biological replicates + SD and are expressed as fold change relative to DMSO + candidalysin at 24 h. F, Representative immunoblot showing phosphorylated (p-) and total eIF4E 30 min and 2 h post-candidalysin stimulation in the presence of BIRB796. Immunoblots are representative of three biological replicates. GAPDH is a loading control. G, Graphical quantification of immunoblots as in F. Scatter plot shows the mean ± SD of three biological replicates expressed as ratios of p-eIF4E/eIF4E. Statistical significance for B and C was quantified by one sample t test compared to a hypothetical value = 1. Statistical significance in D, E and G was quantified by paired t-tests as indicated in the graphs. *P < 0.05, **P < 0.01, ***P < 0.001.

