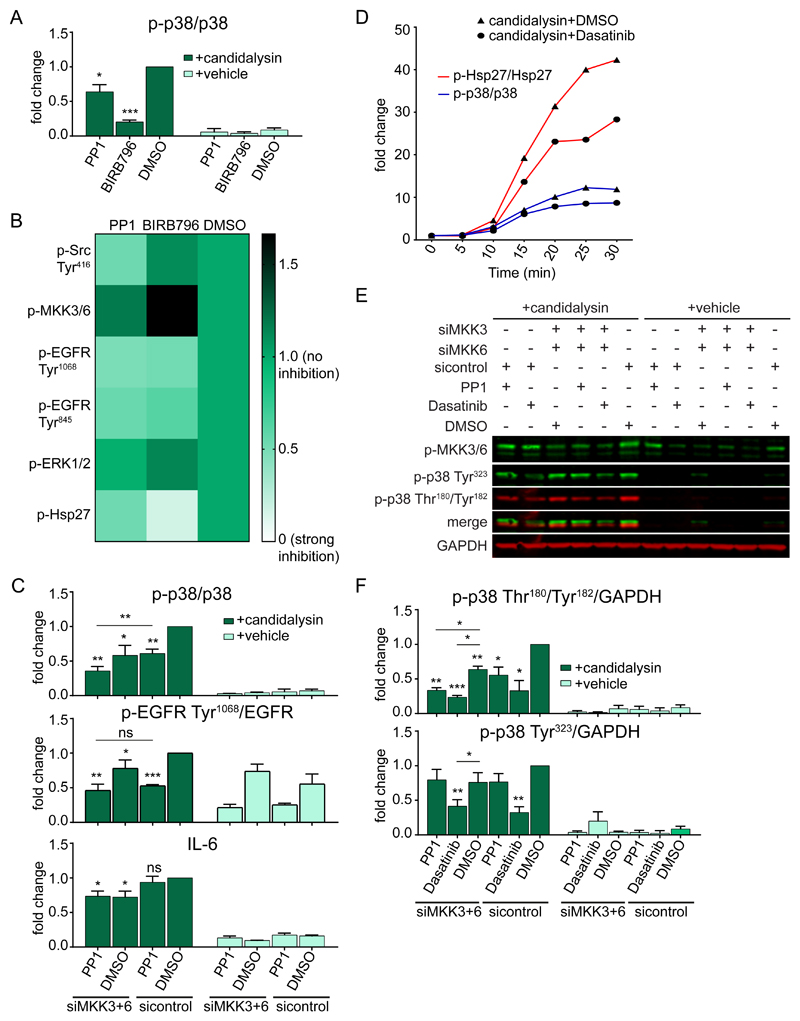
Fig. 5. Src family kinases contribute to candidalysin-induced p38 activation with outputs distinct from MKKs.
A, Graphical quantification of phosphorylated (p-) p38 in TR146 OEC cells treated with PP1 or BIRB796 prior to candidalysin stimulation for 30 min. Corresponding immunoblots are shown in the Supplementary Materials (fig. S6A). B, Visual representation of the amounts of phosphorylated Src (Tyr416), MKK3/6, EGFR (Tyr1068 and Tyr845), ERK1/2, and Hsp27 30 min post-candidalysin stimulation in the presence of PP1 or BIRB796. Corresponding immunoblots and quantitative data are shown in the Supplementary Materials (fig. S6, A and B). C, Quantification of phosphorylation of p38 and EGFR Tyr1068 and the release of IL-6 from TR146 cells transfected for 72 h with siRNA for MKK3 and MKK6 and/or treated with PP1 prior to candidalysin stimulation for 30 min or 24 h, respectively. Corresponding immunoblots are shown in the Supplementary Materials (fig. S6C). D, Graphical quantification of immunoblots (fig. S7C) showing phosphorylation of p38 and Hsp27 in TR146 cells treated with Dasatinib or DMSO and harvested at the indicated times post-candidalysin stimulation. Data are representative of three biological replicates and are expressed as fold change relative to baseline levels at 0 min post-candidalysin stimulation. E, Representative immunoblot showing phosphorylation of MKK3/6 and p38 on Tyr323 and Thr180/Tyr182 from TR146 cells transfected for 72 h with siRNA for MKK3 and MKK6 and/or treated with PP1 or Dasatinib prior to candidalysin stimulation for 30 min. Immunoblots are representative of three biological replicates. GAPDH is shown as a loading control. F, Quantification of immunoblots as in E. Graphs show means of three biological replicates + SD and are expressed as fold change relative to DMSO + candidalysin for A)or DMSO + siRNA control + candidalysin for C and F. Statistical significance in A was quantified by one sample t test compared to a hypothetical value = 1. Statistical significance in C and F was quantified by one sample t test compared to a hypothetical value = 1 and by paired repeated measures one-way ANOVA with Tukey’s multiple comparisons test as indicated in the graphs. *P < 0.05, **P < 0.01, ***P < 0.001.

