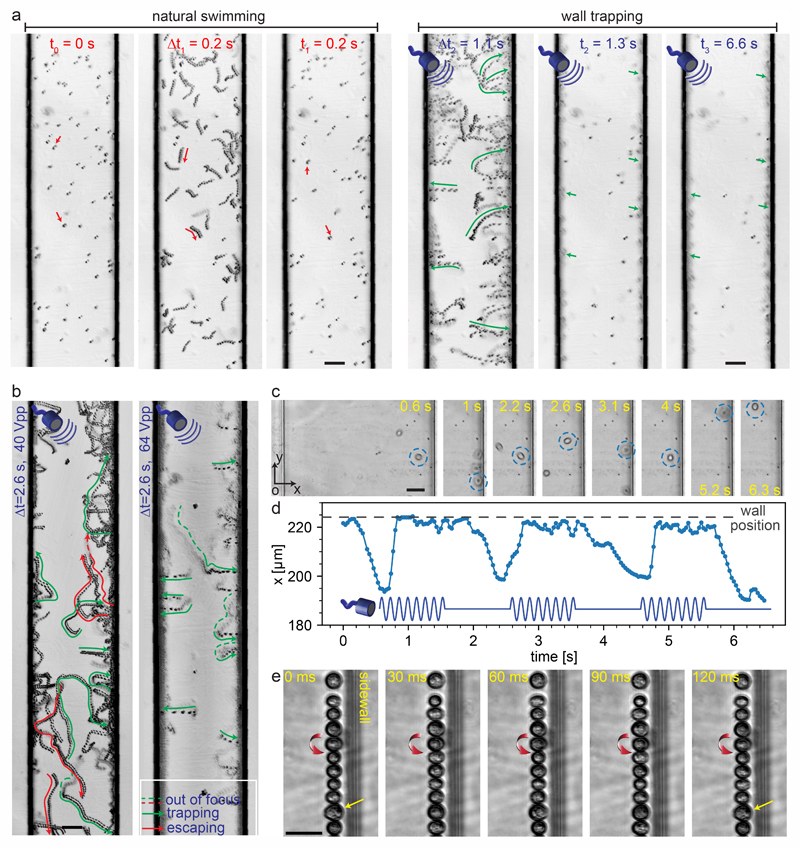
Fig. 6. Microalgae-wall interactions under ultrasonic trapping forces.
(a) Time-lapse images show trajectory of microalgae during 0.2 seconds natural swimming interval to the wall trapping stage during the next 6.4 seconds (Movie S3†). (b) The effect of the driving voltage amplitude on the trapping of microalgae swimmers, the green and red arrows show the trapping and escaping trajectories, respectively (Movie S4†). (c) The time-lapse images of the single microalgae under pulsed ultrasound signal of 2 seconds width, with its center position in x-axis plotted in (d) (Movie S5†). (e) The rotational behavior of the microalgae at the wall boundaries, with a direction denoted by red arrows (Movie S6†). The scale bars in (a) and (b) are 50 μm, and in (c) and (e) are 25 μm.

