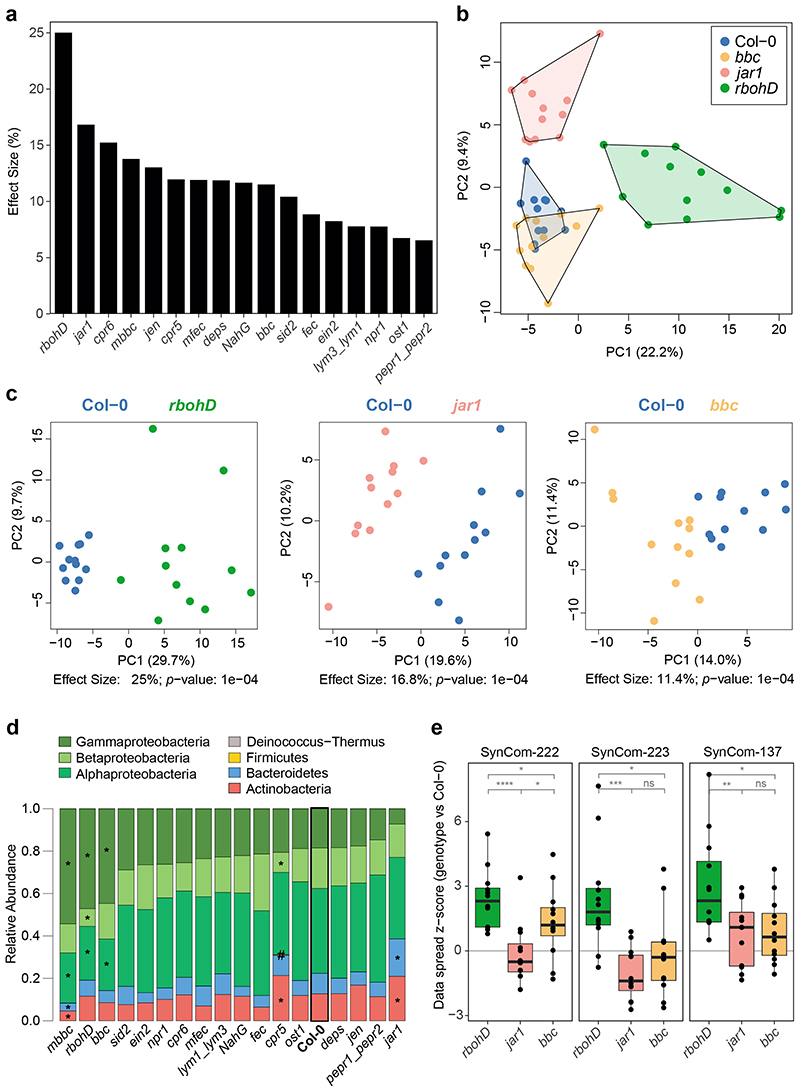
Figure 2. Effect of plant genotype on the leaf endosphere community.
a) The endosphere bacterial community (SynCom-222) of each plant genotype was compared to Col-0 wild-type plants in principal component analysis (PCA, n=12) followed by PERMANOVA (permutations=10,000), and the effect size of the genotype was plotted in decreasing order. b) PCA of bacterial endosphere communities in Col-0 (blue), bbc (orange), jar1 (pink) and rbohD (green). PC1 and PC2 are principal components PC1 and PC2 with their explained variance (%). c) Exemplary PCA of endosphere communities in rbohD, jar1 and bbc. Effect size represents variance explained by genotype, and statistical significance is expressed with p-values determined by PERMANOVA (Benjamini-Hochberg adjusted, n=12). PCA results for all genotypes can be found in Source Data of Fig. 2a. d) Relative abundance of phyla (and classes for Proteobacteria) of endosphere bacteria on the indicated plant genotypes. Genotypes are ordered by decreasing abundance of Gammaproteobacteria. Asterisks (or hash tags for Firmicutes) denote significant differences in taxa on a genotype compared to Col-0 in a two-sided t-test (p<0.05, Benjamini-Hochberg adjusted, n=12). e) Community spread of genotypes rbohD, jar1 and bbc relative to Col-0 in PCA. The community spread was calculated as the Euclidean distance of data points to the centroid in PCA. Distances of genotypes were normalized to the median distance of Col-0 as the z-score. Community spread was calculated for SynCom-222, SynCom-223 and SynCom-137. Box plots show the median with upper and lower quartiles and whiskers present 1.5x interquartile range. Statistical differences were determined by two-sided t-test (n=12; ns, not significant; *p<0.05; **p<0.01; ***p<0.001).

