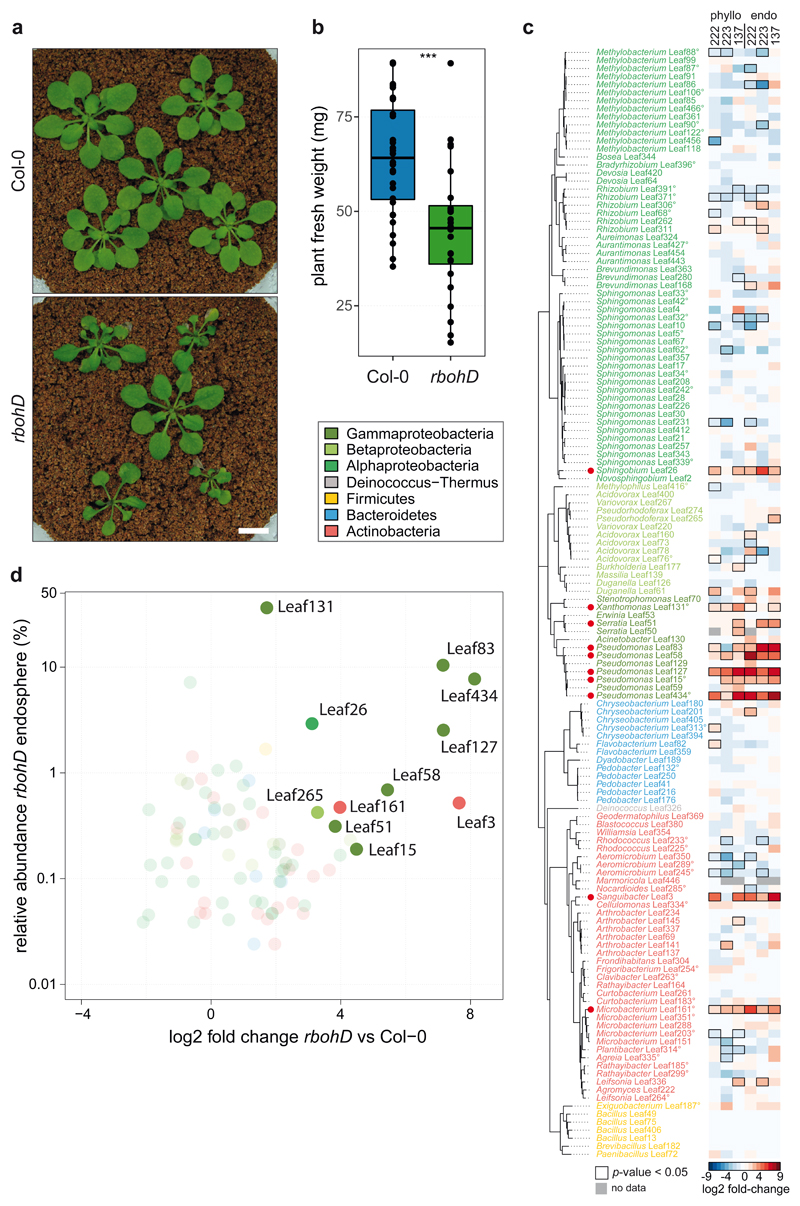
Figure 3. The plant mutant rbohD shows a dysbiosis phenotype and assembles a microbiota enriched in Gammaproteobacteria.
a) Representative pictures of five-week-old Col-0 and rbohD inoculated with SynCom-137. White bar indicates one cm. b) Fresh weight of aboveground plant tissue of Col-0 and rbohD inoculated with SynCom-137. Box plots show the median with upper and lower quartiles and whiskers present 1.5x interquartile range (n= 12; two-tailed Mann-Whitney U-test; ***, p<0.001). c) Heatmap shows log2 fold-changes of strains in phylogenetic order in rbohD compared to Col-0 wild-type plants. Columns show phyllosphere and endosphere samples from plants inoculated with either SynCom-222, SynCom-223 or SynCom-137. Black rectangles show significant changes, p<0.05 (n=12; Wald test, Benjamini-Hochberg adjusted). Strains (or ASVs indicated by superscript circles) are colored according to phylogeny. Red dots highlight enriched strains in rbohD across multiple experiments. d) Volcano plot shows the relative abundance of rbohD-enriched strains of SynCom-137 in rbohD endosphere (log2-fold-changes in rbohD compared to Col-0 with adjusted p-value <0.05).

