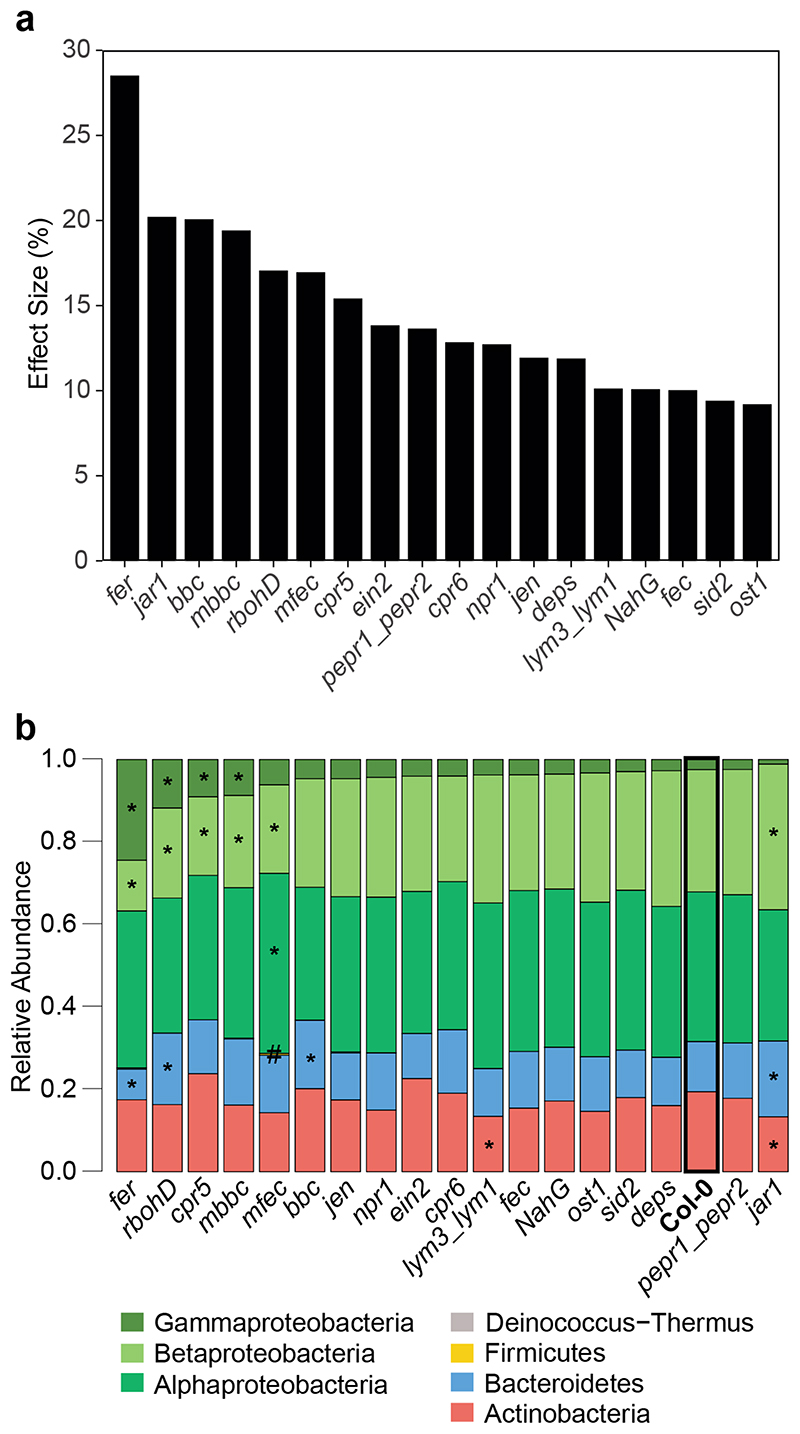
Extended Data Fig. 3. Genotype effect on bacterial community in phyllosphere.
a) Effect of plant genotype on phyllosphere community. The bacterial community of each genotype was compared to Col-0 wild-type in principal component analysis (PCA, n=12) followed by PERMANOVA (permutations=10,000), and the effect size of the genotype was plotted in decreasing order. Effect size represents variance explained by genotype (p-value<0.05, Benjamini-Hochberg adjusted; n=12). b) Relative abundance of phyllosphere bacteria on the indicated plant genotypes. Asterisks (or hash tags for Firmicutes) denote significant differences in taxa on genotypes compared to Col-0 in a two-sided t-test (p<0.05, Benjamini-Hochberg adjusted, n=12).

