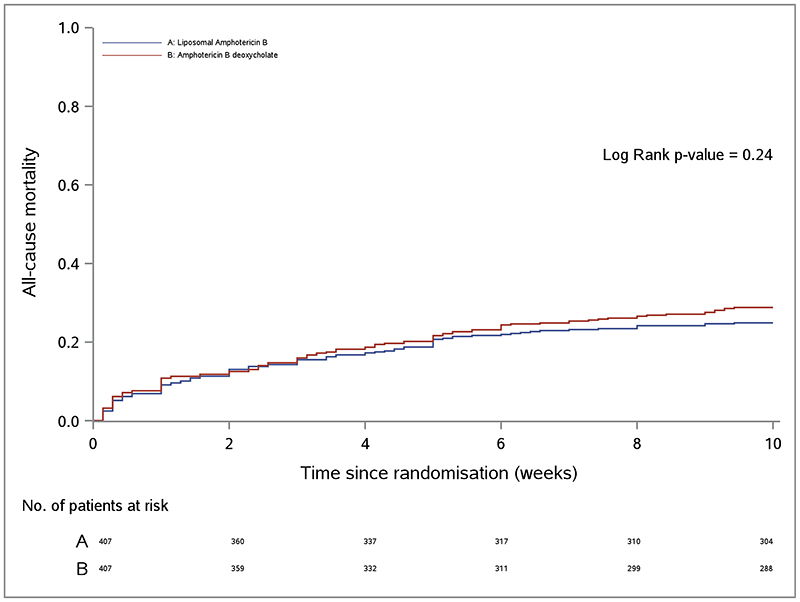
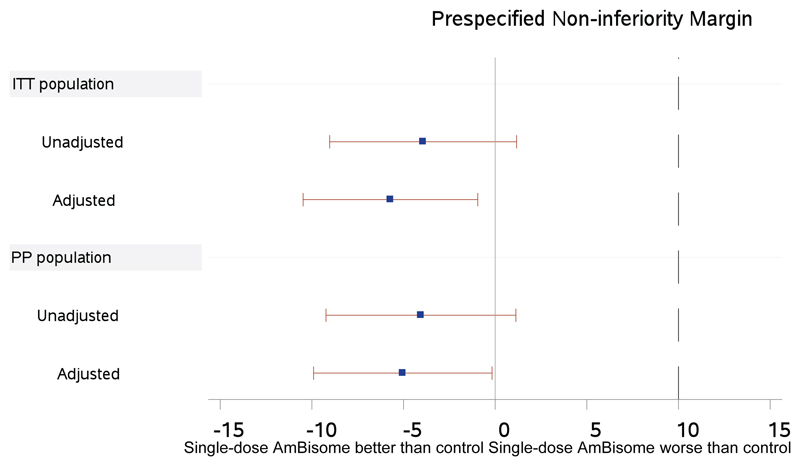
Figure 2. All-cause mortality.
Panel A shows the cumulative all-cause mortality by week 10 according to treatment strategy in the intention-to-treat population. Panel B shows a non-inferiority graph for differences in all-cause mortality at 10 weeks. The mean difference in 10-week mortality risk (absolute percentage difference) between the AmBisome and control arms and the two-sided 90% confidence intervals in both unadjusted and adjusted intention-to-treat and per-protocol analyses are shown. The dashed line indicated the prespecified 10% non-inferiority margin. Adjusted analysis adjusting for pre-specified baseline covariates of: site, age, sex, Glasgow Coma Scale, CD4 count, cerebrospinal fluid colony forming units/mL, HIV therapy status, hemoglobin, and CSF opening pressure.


