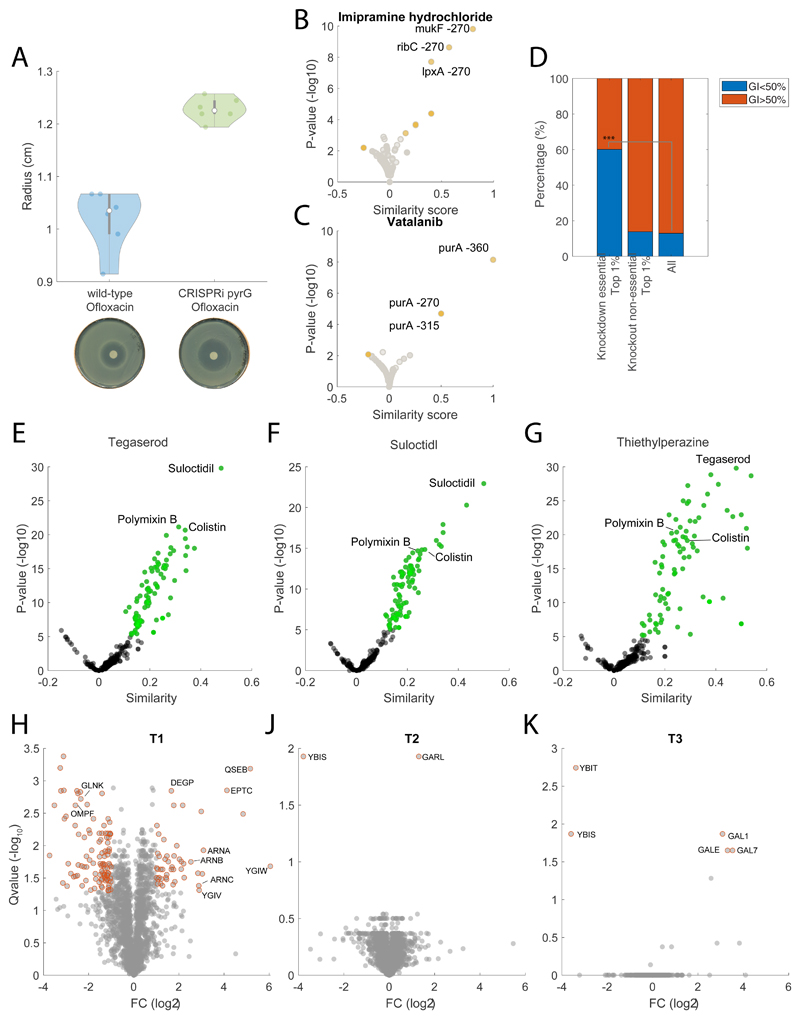
Extended Data Fig. 6. Gene-drug associations.
A) Disk diffusion assay testing the susceptibility to ofloxacin (10 μg) in wild-type E. coli and pyrG knockdown. Violin plot represents mean ± SD across 3 biological replicates. Two representative petri dishes are reported on the lower panel. B) Imipramine gene-drug associations. Volcano plot of similarities between drug and knockdowns time dependent metabolic profiles. Notably, we found genes exhibiting more rare but strong associations to chemically induced metabolic changes, such as the association between the gene mediating chromosome partitioning during division mukF, and imipramine, a drug typically used as antidepressant, potentially hinting at the toxic side effects of imipramine as DNA damaging agent; C) Vatalanib gene-drug associations. Vatalanib, a tyrosine kinase inhibitor that interferes with the ATP-binding site of vascular endothelial growth factor receptors (VEGFR1-3), induces similar metabolic changes to purA knockdown, a key gene in the adenosine ribonucleotides de novo biosynthesis. D) fraction of compounds inhibiting at least 50% of the growth-rate at 100μM for (i) compounds within the top 1% of drug-gene knockdown similarities, (ii) compounds within the top 1% of drug-gene knockout similarities (data reported in27), (iii) all tested compounds. We found that drugs with strong similar metabolic profiles to at least one essential gene knockdown (i.e. top 1% of all drug-genes associations) are significantly enriched (pvalue = 2.3071e-183 ≤ 0.001 ***, from 13% to 60%) for drugs inducing Growth Inhibition (GI) greater than 50%. On the contrary when selecting the top 1% of similarities between drugs and the ~3800 non-essential gene knockout7 27, we found no significant enrichment and the majority of drugs exhibits relatively low growth inhibition (GI<50%). E-F-G) Volcano plot of similarities between tegaserod, suloctidil, thiethylperazine and the remaining 1341 drugs. Pvalues are estimated by hypergeometric test analysis. H-J-K) Volcano plot of proteome changes in three tegaserod resistant strains (Table 1 of the main text) with respect to the ancestor wild-type E. coli (Table S7). Proteins with significant (qvalue≤0.05 and | FC|≥1) changes with respect to the wild-type are highlighted in red. Pvalues are estimated by two-sided t-test analysis and corrected for multiple tests.

