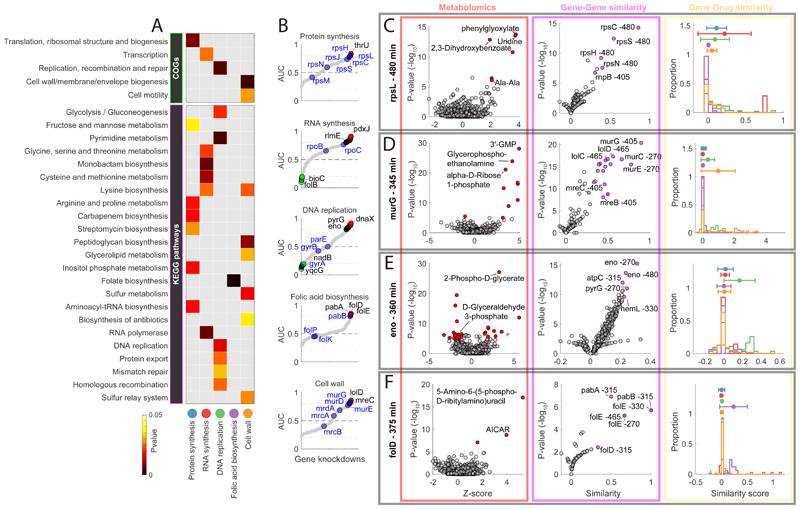
Figure 2. Functional associations between gene knockdowns and major antibiotic classes.
A) The heatmap highlights the functional groups of genes (i.e. COGs or KEGG pathways) that exhibit the most significant (pvalue≤0.05) averaged similarity to metabolic changes induced by antibiotics in 5 major classes. B) Sorted maximum AUC indexes estimated for each knockdown and antibiotic class (grey dots). Primary drug targets are highlighted in blue. Genes with an AUC greater than 0.8 or lower than 0.2 are marked in red and green respectively. C-D-E-F) Metabolic profiles (red panel), gene-gene similarity (purple panel) and associations with compounds in 5 major antibiotic classes (yellow) panel, for 4 gene knockdowns: rpsL (480 minutes after CRISPRi induction), murG (345 minutes after CRISPRi induction), eno (360 minutes after CRISPRi induction) and folD (375 minutes after CRISPRi induction). The volcano plots illustrate: the metabolic changes averaged over 3 biological replicates (i.e. Z-score and pvalue significance) for 991 putatively annotated metabolites (left, red panel); similarity between knockdown metabolic profiles (i.e. similarity and pvalue significance)(right, purple panel). Metabolites that are significantly (two-tailed t-test analysis) affected by the gene knockdown and genes that exhibit significant (hypergeometric test) metabolic similarities are highlighted in red and purple, respectively. Histograms (yellow panel) represent the distributions of similarities scores (iSim) with compounds in each major antibiotic class.

