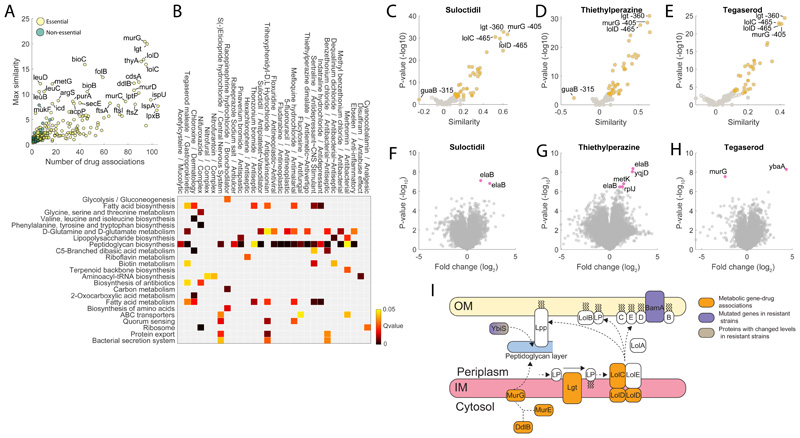
Figure 4. Chemical vs genetic interference.
A) Number of significant (top 1%) associations with drugs and the max similarity for each gene knockdown. B) The heatmap highlights drugs with a GI50 below 100μM that exhibit a significant (qvalue≤0.05) enrichment of gene associations with at least one KEGG pathway. C) Volcano plot of similarities between suloctidil and knockdowns metabolic profiles. D) Volcano plot of similarities between thietylperazine dimalate and knockdowns metabolic profiles. E) Volcano plot of similarities between tegaserod maleate and knockdowns metabolic profiles. Pvalues were estimated by hypergeometric test (see iSim). G) Volcano plots of limited proteolysis samples from E. coli lysates treated with suloctidil. Peptide mixes produced in the presence or absence of 500 μM suloctidil are compared. Fold changes (FC) in peptide abundance for treated and untreated samples are shown as a function of statistical significance. Significance cutoffs were pvalue = 3.3807e-07 (two-tailed t-test analysis, Bonferroni corrected) and FC = 1. Peptides passing both cutoffs are in purple and labeled by protein name (Supplementary Dataset 4). H) Volcano plots of limited proteolysis samples from E. coli lysates treated with thietylperazine dimalate. I) Volcano plots of limited proteolysis samples from E. coli lysates treated with tegaserod maleate. Data represent the average over 3 biological replicates. I) Schematics of metabolome derived gene-tegaserod associations and their relation to genetic and proteome changes in tegaserod resistant strains.

