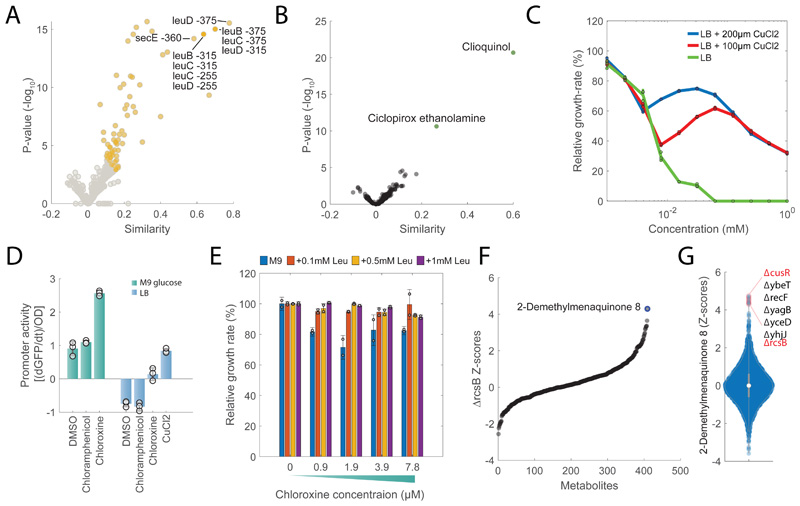
Figure 5. Gene-Drug associations.
A) Volcano plot of similarities between chloroxine and knockdowns metabolic profiles at different time points. Chloroxine gene-drug associations that are among the top 1% are highlighted in yellow. Pvalues are estimated by hypergeometric test (see iSim). B) Volcano plot of similarities between chloroxine and the remaining 1341 drugs. Pvalues are estimated by hypergeometric test (see iSim). C) Growth rates at different concentrations of chloroxine relative to the untreated condition. Wild type E. coli was grown in LB medium with and without 100 or 200 μM of CuCl2 . Bar plot are mean ± standard deviation across three biological replicate. D) Promoter activity of cueO in M9 glucose medium and LB media with 7.8 μM chloroxine, 155 μM chloramphenicol and 185 μMCuCl2. Bar plots represent mean ± standard deviation of promoter activities in mid-log growth phase over 3 biological replicates. E) Growth rates at different concentrations of chloroxine relative to the untreated condition. Wild type E. coli was grown in M9 medium with and without 0.1/0.5/1 mM of leucine. Bar plot are mean ± standard deviation over two biological replicates. F) Relative metabolite z-score levels in ΔrcsB27. G) Relative z-score levels of 2-demethylmenaquinone across 3807 E. coli non-essential knockout strains27.

