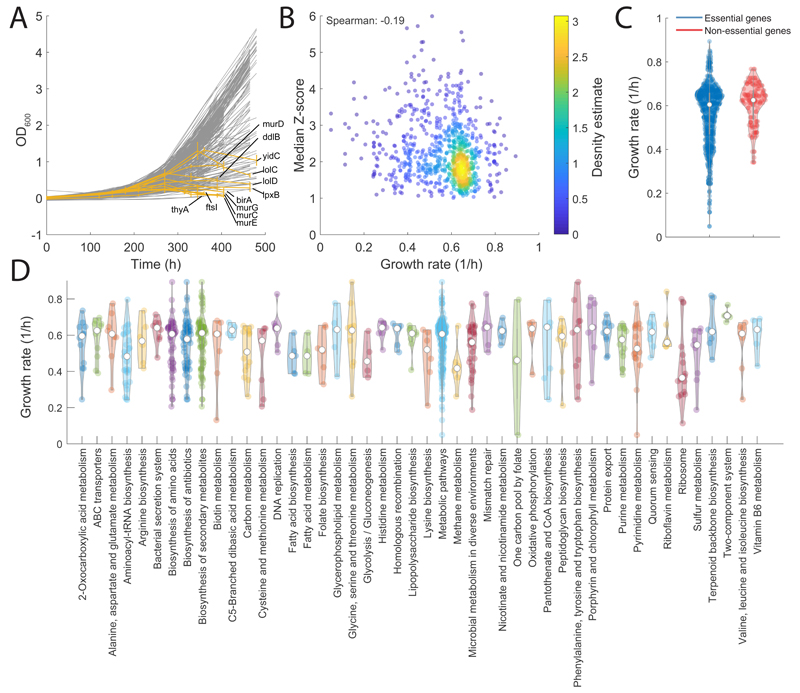
Extended Data Fig. 2. Analysis of growth phenotypes.
A) Growth dynamics of each individual mutant. Each line corresponds to the OD averaged across 3 biological replicates. In orange, mutants exhibiting a sudden drop in OD are highlighted. B) Median absolute Z-score of significantly affected metabolites in each mutant/time point vs estimated growth rate. As expected the slower the growth rate the larger is the impact of gene knockdowns on metabolism7, although the dependency is mild: Spearman correlation of -0.19. C) Distribution of growth rates for essential and non-essential gene knockdowns. D) Distribution of growth rates for gene knockdowns across KEGG pathways.

