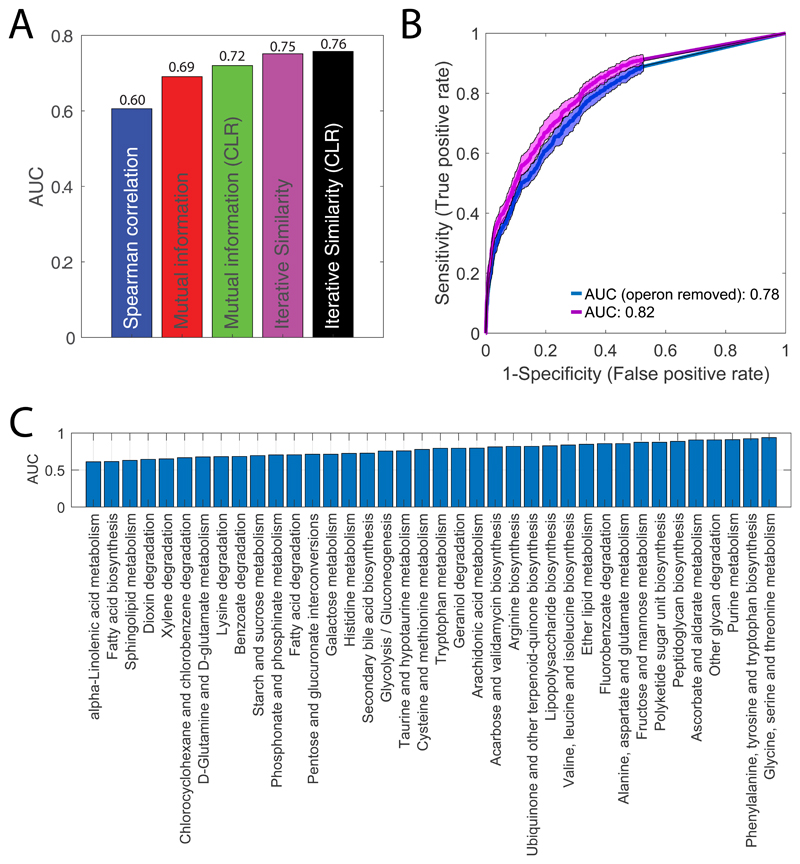
Extended Data Fig. 3. Metabolome-based predictions of functional gene-gene similarity.
A) ROC analysis comparing the performance of different similarity metrics in detecting pair of genes that are either encoding for subunits of the same protein complex or for iso-enzymes. We used previously published data27 profiling the metabolome across 3873 gene knockout mutants. We selected only genes encoding for proteins complexes and isoenzymes with at least one significant metabolic changes as defined in 27 (|Z-score|>5). Area Under the Curve (AUC) is reported for Spearman correlation, mutual information, context likelihood of relatedness (CLR) 60 applied on mutual information, iterative similarity and CLR applied on iterative similarity (iSim). The best performance was obtained with iSim (Table S1). To cope with the fact that similarity metrics, like mutual information, can be biased by hidden global patterns in the data (in our case likely to reflect indirect and general type of effects (e.g. growth rates)), and to take into account the typical patterns of interaction of multivariate datasets, the authors in 60 developed an effective and simple approach to normalize pair wise mutual information. The CLR algorithm applies an adaptive background correction step to the matrix of pair-wise similarity scores to eliminate indirect global similarities between drug/gene knockdown metabolome profiles. After computing the similarity between drug/gene pairs, the algorithm compares the similarity between drug/gene A and drug/gene B to the background distribution of similarity scores calculated for all possible drug/gene pairs that include either A or B. The pairs with the most probable functional associations are those whose similarity scores is larger than the background distribution of similarity scores. This step, when applied on mutual information, improves predictions by eliminating “promiscuous” cases, where one gene weakly co-varies with a large numbers of genes. The improvement of CLR applied on iSim are minor. Hence, in this work iSim is used instead of iSim+CLR. B) For each gene, we ranked gene-gene metabolic similarity and performed KEGG-functional enrichment analysis -i.e. KEGG pathways that exhibit a significant (qvalue≤0.01) enrichment of gene knockdowns exhibiting similar metabolic profiles. In blue the ROC curve obtained by considering only similarities between gene pairs from different operons. In purple, we report ROC analysis of KEGG functional enrichment without accounting for operon structure. D) Each corresponds to a KEGG metabolic pathway and the respective AUC values estimated from gene-gene similarity. Only KEGG pathways with an AUC≥0.6 are reported.

