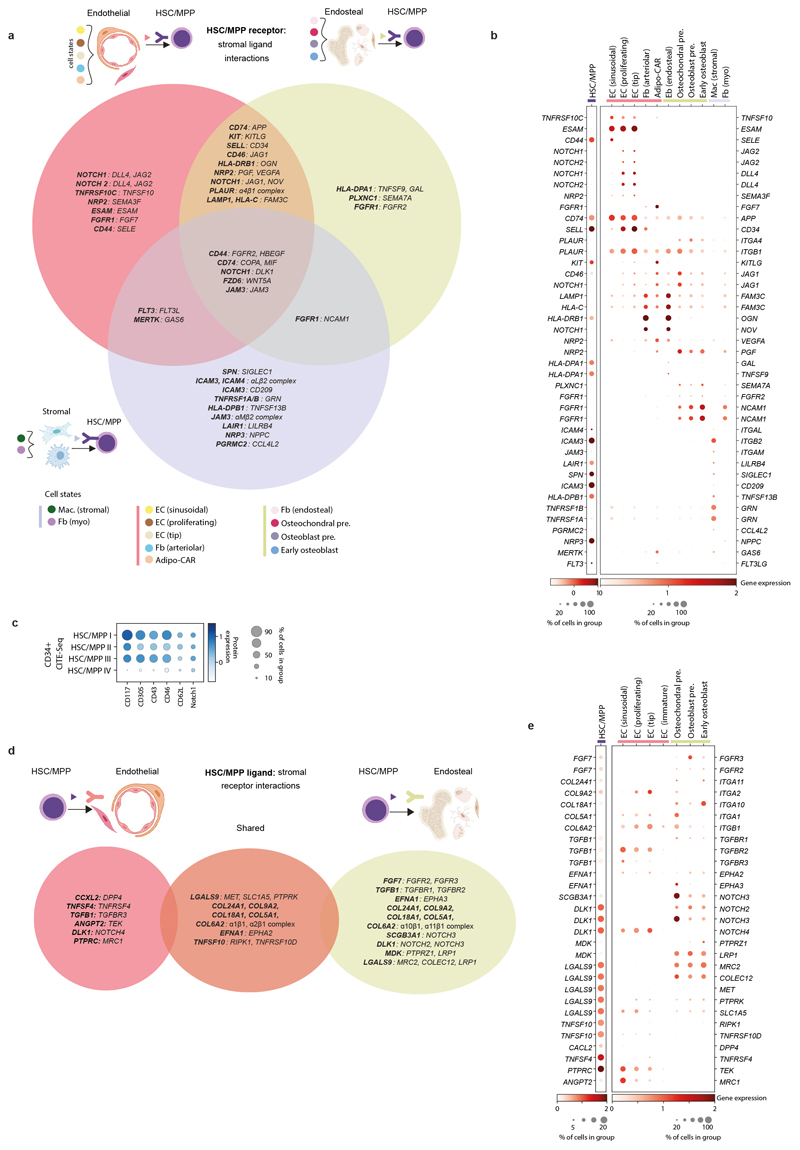
Extended Data Figure 10. Stromal cell heterogeneity in FBM.
10a) Summary of receptor-ligand interactions predicted by CellPhoneDB (see Methods) between FBM stromal ligands and HSC/MPP receptors (Supplementary Table 49). Significant putative receptor-ligands across FBM neighbourhoods are indicated in Venn diagram overlapping regions. Figure was created using BioRender.com.
10b) GEX dotplot for FBM scRNA-seq stromal ligands and HSC/MPP receptors with role in CellPhoneDB-predicted receptor-ligand interactions shown in panel a. Methods/interpretation as shown in Fig. 1b (upper limit of 2 for both dotplots). Colours represent grouping of stromal cell types, as in panel a.
10c) Protein dotplot for CD34+ CITE-seq HSC/MPPs receptors with role in CellPhoneDB-predicted receptor-ligand interactions as per panels a-b. Methods/interpretation as in Extended Data Fig. 1f(upper limit of 1.5).
10d) Summary of receptor-ligand interactions predicted by CellPhoneDB between FBM HSC/MPP ligands and stromal receptors (Supplementary Table 49). Interpretation as detailed in panel a, and cell-type groupings detailed in Methods.
10e) GEX dotplot for FBM scRNA-seq stromal receptors and HSC/MPP ligands with role in CellPhoneDB-predicted receptor-ligand interactions shown in panel d. Methods/interpretation as shown in Fig. 1b (upper limit of 20% was placed on the HSC/MPP dotplot and upper limit of 2 was placed on both dotplots).

