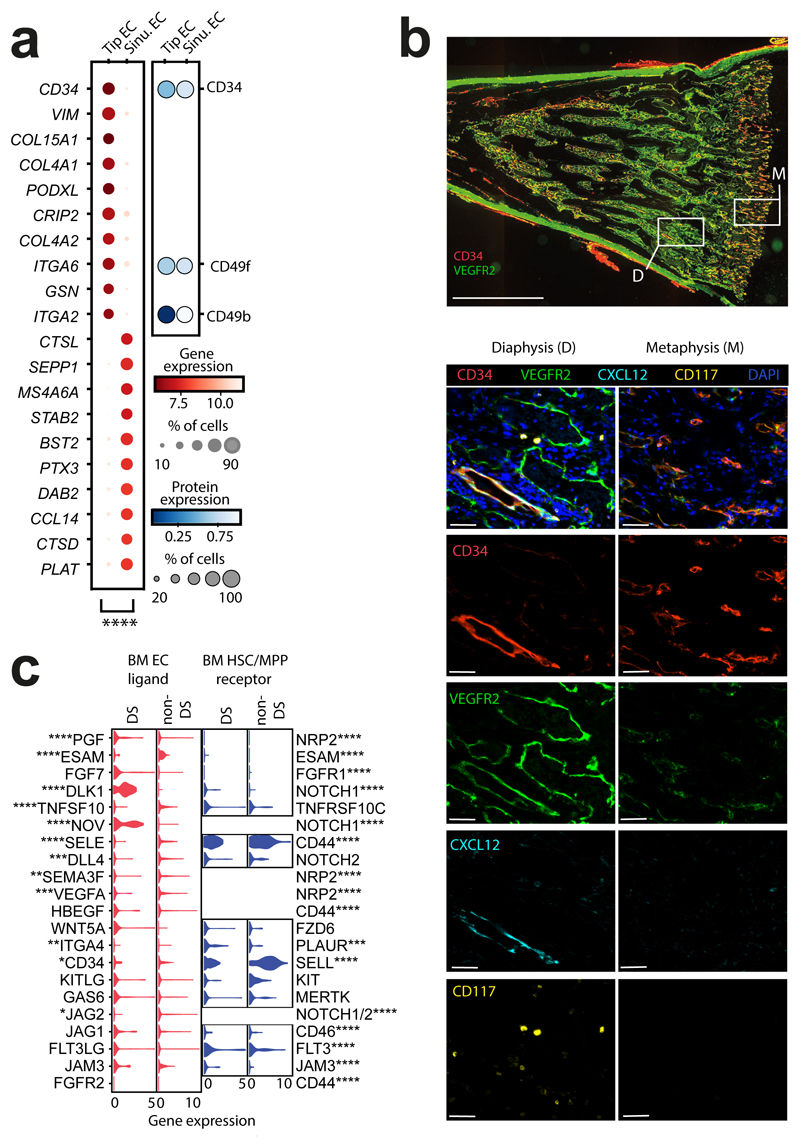
Figure 3. Stromal cell heterogeneity in FBM.
3a) Left: dotplot of top 10 genes (by p-value) differentially expressed between tip EC (k=362) and sinusoidal ECs (k=550) in FBM scRNA-seq data (n=9) (Methods/interpretation as in Fig. 1b; two-sided Wilcoxon rank-sum test with Benjamini-Hochberg correction; ****=p<0.0001, Supplementary Table 24). Right: dotplot of equivalent protein expression (where antibody present in CITE-seq panel) on tip and sinusoidal ECs in the FBM (total) CITE-seq dataset (n=3). Dot colour indicates DSB-normalised protein expression. Dot size indicates the percentage of cells in each category expressing a given protein.
3b) Top: longitudinal section of fetal femur with multiplex IF staining, showing CD34 (red) and VEGFR2 (green) channels to demonstrate regional differences in BM vasculature between metaphysis (M) and diaphysis (D). Scale bar; 2mm. White boxes locate regions of interest (ROI) shown below. Bottom: ROIs with all channels and single channels to demonstrate patterns of co-expression in CD34hiVEGFRlo metaphyseal vessels, VEGFR2hiCD34hi diaphyseal sinusoids and CD34hiCXCL12-associated arterioles. Scale bars; 50µm. Representative images from n=4 biologically independent FBM samples (14-15 PCW), with staining performed in 2 independent experiments.
3c) Violin-plots of gene expression in HSC/MPPs and pooled ECs from DS (n=4; k=105 HSC/MPPs; k=111 ECs) and non-DS (n=9; k=92 HSC/MPPs; k=938 ECs) FBM scRNA-seq datasets. Genes shown have a significant receptor-ligand interaction in non-DS FBM predicted by CellPhoneDB analysis (detailed in Extended Data Fig. 10a-b). Significance in expression difference between DS and non-DS calculated by two-sided Wilcoxon rank-sum test with Benjamini-Hochberg correction; *p<0.05,**p<0.01,***p<0.001,****p<0.0001; Supplementary Table 25).

