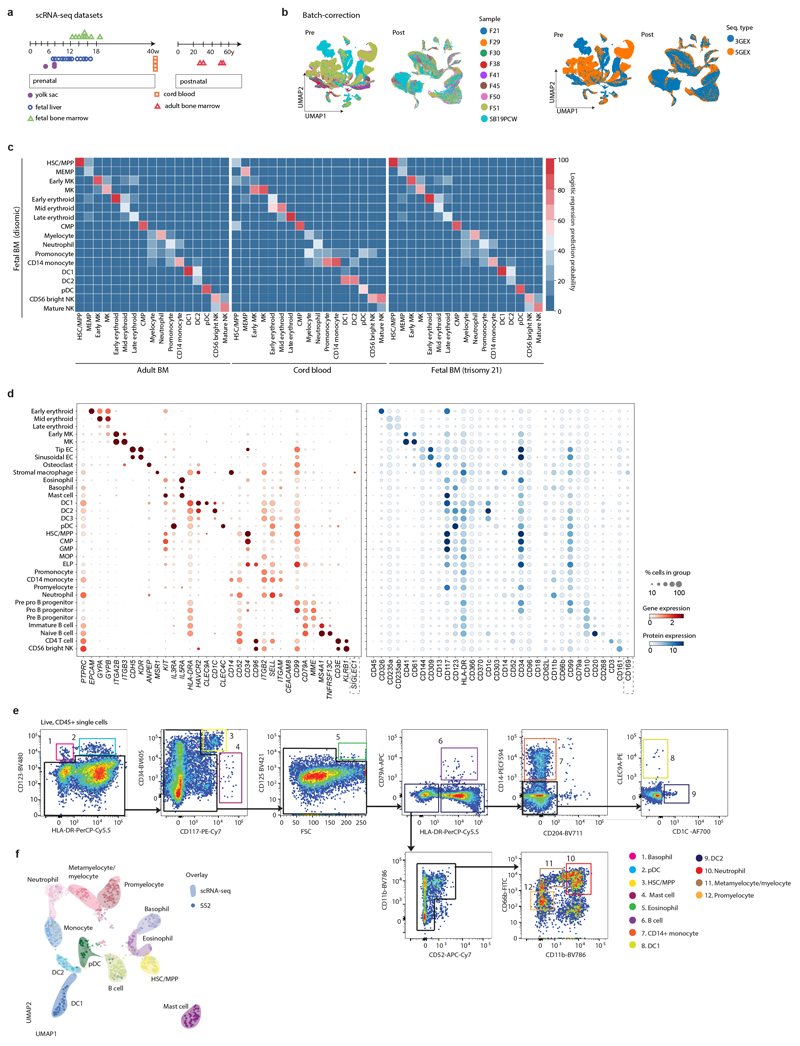
Extended Data Figure 1. A single cell atlas of human FBM.
1a) Summary of FBM scRNA-seq dataset and reference scRNA-seq datasets used in this study, including published YS/FL data4 and publicly available CB/ABM data from the Human Cell Atlas Data Coordination Portal.
1b) UMAP of FBM scRNA-seq data (as per Fig. 1a) pre- and post- Harmony batch correction. Sequencing type and sample is represented by colour.
1c) Logistic regression for intersecting cell states annotated in FBM, ABM, CB, and DS FBM scRNA-seq datasets. Prediction probability indicated by colour scale.
1d) Dotplots for expression of selected cell-state defining genes (left) in FBM CITE-seq data where corresponding protein was available in the ADT panel (right). Genes were selected from DE analysis (two-sided Wilcoxon rank-sum statistical test with Benjamini-Hochberg procedure for multiple testing correction; Supplementary Table 12). Markers used for FACS isolation are shown in bold type. Log-transformed, normalised and scaled gene expression values (upper limit 3) and DSB-normalised protein expression values (upper limit 15) are represented by the colour of the dots. Percentage of cells in each cell type expressing the marker is shown by the size of the dot. To contextualise dotplots shown in this panel, DE proteins were independently calculated for the FBM CITE-seq data (Supplementary Table 13), with method as described above for genes.
1e) FACS strategy used to isolate cell types for validation based on cell-state defining markers from scRNA-seq data. Representative plots from n=2 samples (17 PCW) are shown. Gating strategy is described in Methods.
1f) UMAP of FBM SS2 scRNA-seq data (n=2, k=486, 17 PCW; Supplementary Table 15) with a 50-cell per subset sample of predicted 10x scRNA-seq counterparts (n=9, k=600). 10x scRNA-seq data represented by coloured areas and SS2 data represented by dots of equivalent colour.

