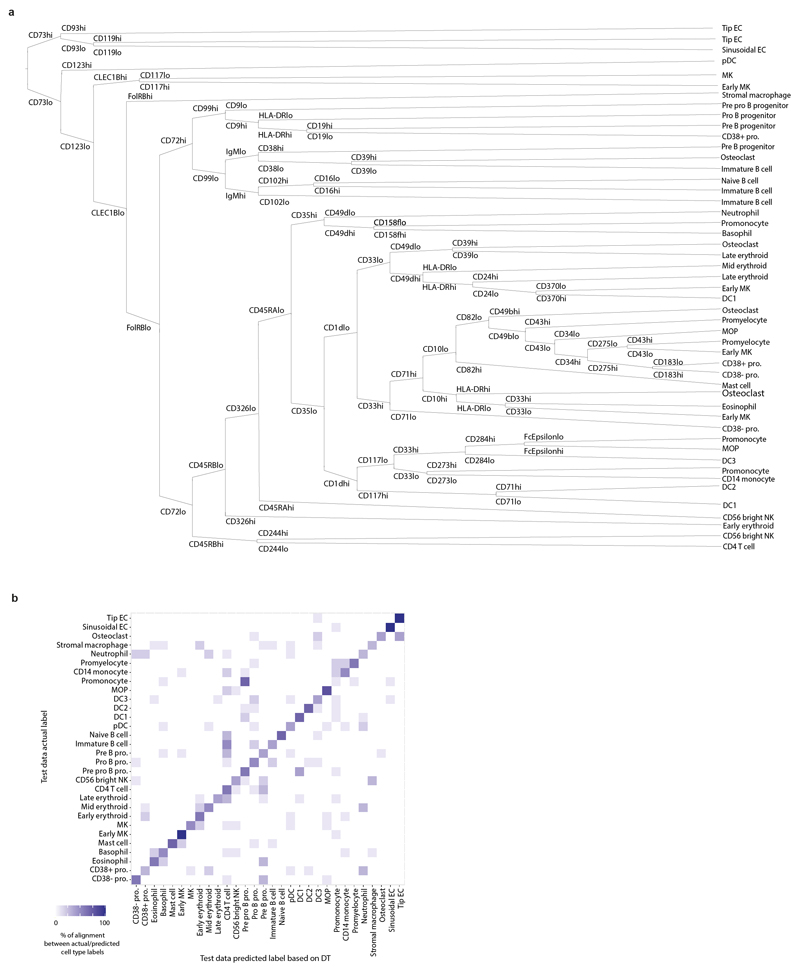
Extended Data Figure 2. A single cell atlas of human FBM.
2a) Continuous decision tree constructed using the Rpart package to distinguish between the lineage-committed immune cell types in FBM (total) CITE-seq data using the 198 epitopes detected (see Supplementary Methods). Node splits were labelled ‘lo’ or ‘hi’ for visualisation purposes. The branch rules of the tree operate on continuous protein expression values.
2b) Confusion matrix showing the actual cell type labels and the predicted cell type labels for the decision tree (in panel a) when run on the test data (see Methods). Sensitivity and specificity are illustrated in this heatmap, with complete statistics provided in Supplementary Table 14. Overall accuracy computed with 95% CI using a binomial test and checked with a one-sided test (see caret package documentation for confusionMatrix function).

