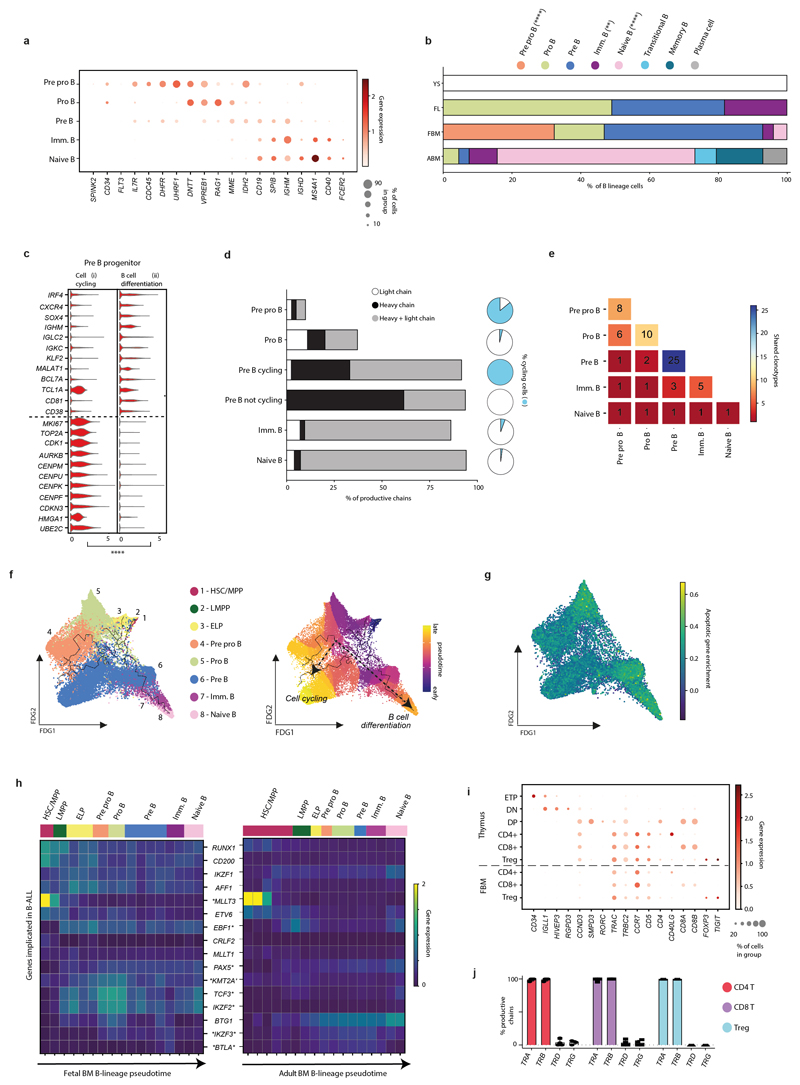
Extended Data Figure 4. Expanded B-lymphopoiesis in FBM.
4a) Dotplot of cell state-defining genes for FBM scRNA-seq B-lineage. Methods/interpretation as in Fig. 1b. Abbreviations as in Fig. 2b.
4b) Barplot for mean proportions of B-lineage cell states in FL (n=14), FBM (n=9) and ABM (n=4) scRNA-seq datasets (n=biologically independent samples; B lineage absent in n=3 YS). P-values resulting from quasibinomial regression model (subject to one-sided ANOVA; with correction for sort gates; computed at 95% CI and adjusted for multiple testing using Bonferroni correction) are shown in parentheses; **p<0.01, ****p<0.0001; Supplementary Table 19, 23).
4c) Violin-plot of DEGs (computed using two-sided Wilcoxon rank-sum statistical test with Benjamini-Hochberg procedure for multiple testing correction; ****=p<0.0001; Supplementary Table 34) across FBM scRNA-seq Pre-B progenitor paths as in Fig. 2b; see Methods). GEX are log-transformed, normalised and scaled.
4d) Barplot showing mean proportion of productive heavy/light chains in FBM B-lineage cells present in both mRNA/BCR-enriched scRNA-seq (n=2, k=5,052). Pie-charts show the proportion of cycling cells (see Methods) per cell-type.
4e) Heatmap of shared clonotypes between FBM B-lineage cell types, as defined by CellRanger.
4f) FDG of B-cell development (k=30,066) in the FBM scRNA-seq dataset. Colour indicates state (left) and Monocle3 pseudotime value (right). Paths as in Fig. 2b.
4g) FDG of B-lineage (k=28,583) in the FBM scRNA-seq dataset. Colour indicates apoptotic gene enrichment score (see Methods/legend).
4h) Heatmap of B-ALL-implicated genes across Monocle3-inferred FBM/ABM B cell development pseudotime (see panel F; Supplementary Tables 32, 35-37; DEGs across pseudotime marked with asterisk; one-sided Moran’s I statistical test). Log-transformed, normalised and scaled GEX (upper limit of 2).
4i) Dotplot comparing expression of characteristic T-cell genes in cell states from thymus and FBM scRNA-seq datasets (see Methods). Interpretation as in Fig. 1b. Abbreviations: ETP = early thymocyte precursor; DN = double negative; DP = double positive.
4j) Barplot of productively rearranged TRA/B/G/D chains by T-cell state in n=4 biologically independent FBM samples at 14-17 PCW, k=194 cells. Chain rearrangements were as defined by CellRanger. Bars show mean and error bars SD. Mean±SD TCR productivity was 97±7%, 90±14% and 96±8% for CD4-T, CD8-T and Treg.

