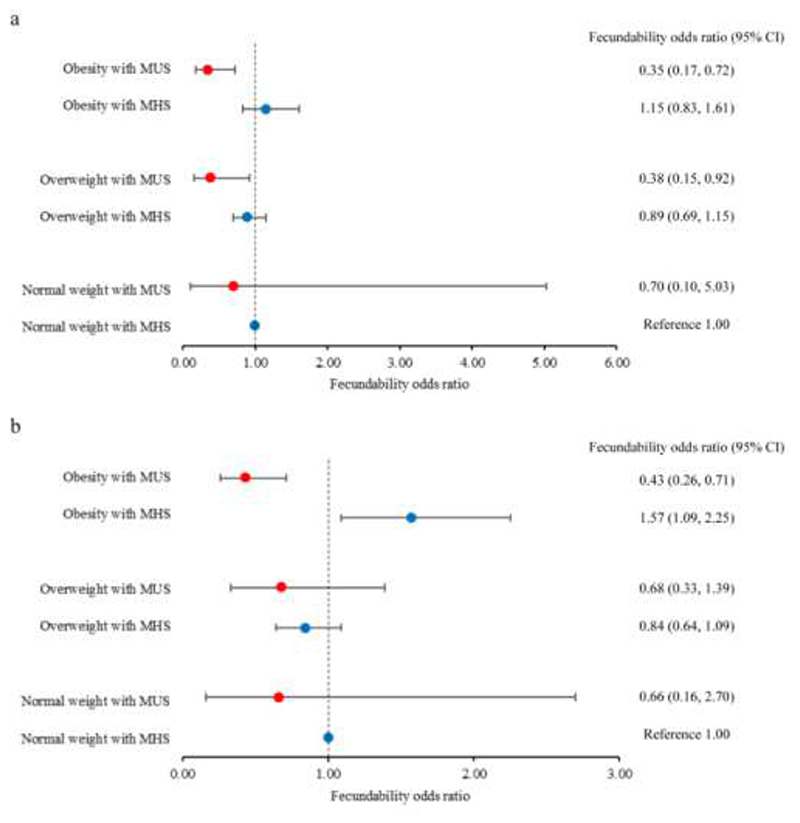
Figure 1.
Forest plots showing fecundability odds ratios according to metabolic health status of normal weight (18.5-22.9 kg/m2), overweight (23-27.4 kg/m2) and obese women (≥27.5 kg/m2) trying to conceive. Body mass index categories were based on cut-offs for Asian populations. Metabolic health status was defined by (a) metabolic syndrome ≤2 (MHS) vs. ≥3 (MUS) criteria; and (b) HOMA-IR <2.5 (MHS) vs. ≥2.5 (MUS). The dots and capped lines represent point estimates and 95% confidence intervals, respectively, of fecundability odds ratios. The reference group comprised normal weight women with MHS. Data were analyzed using discrete-time proportional hazards models, adjusting for age, ethnicity, education, physical activity, smoking exposure and alcohol intake. HOMA-IR, homeostasis model assessment-insulin resistance; MHS, metabolically healthy status; MUS, metabolically unhealthy status.

