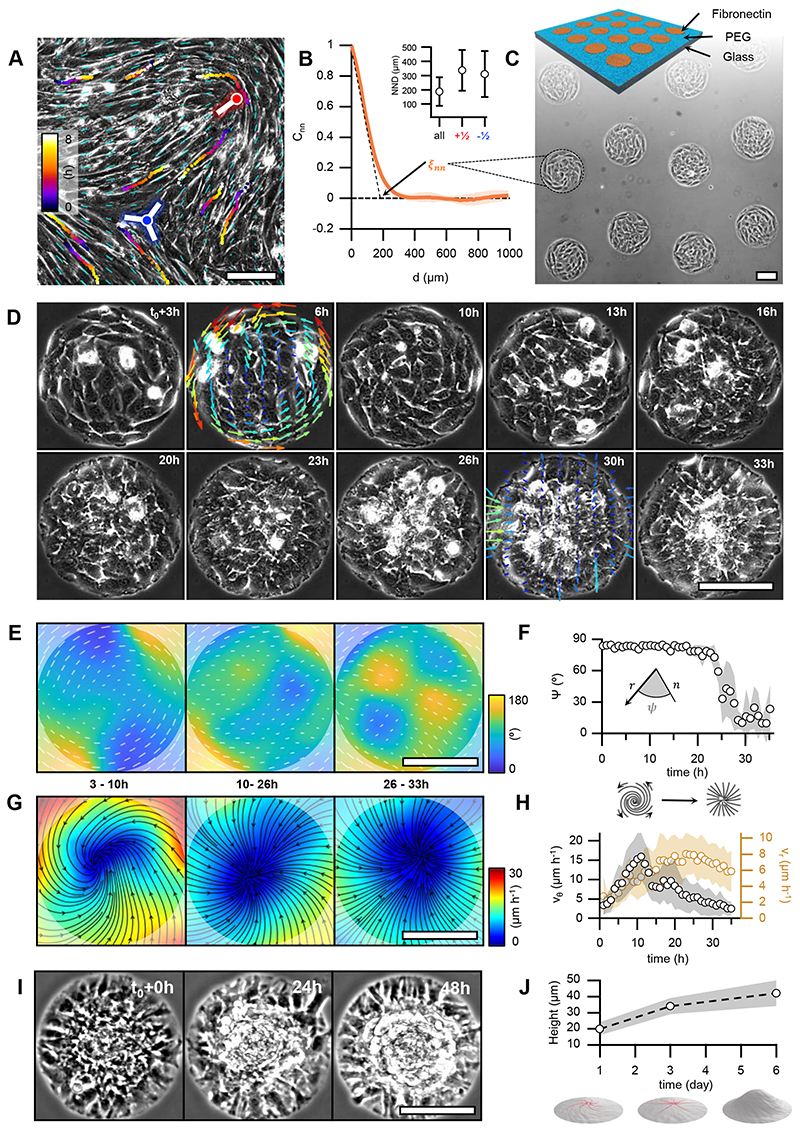
Figure 1. Myoblasts arrange into integer topological defects on circular micropatterns.
A, Phase contrast image of a confluent monolayer of myoblasts. Cyan dashes indicate the local orientational field. Positions of half-integer topological defects are shown (blue dot, s=-½; red dot, s=+½). Trajectories of single cells are depicted with color gradients. Colormap represents time. B, Spatial autocorrelation function Cnn of the orientational field. ξnn is the nematic correlation length. Inset: nearest neighbor distance (NND) between half-integer, +½ and -½ topological defects. C, Scheme of the micro-patterned surface and corresponding phase-contrast image with confined myoblasts in circular domains of radius r=100μm. D, Time series of a single myoblast disc (r=100μm). t=t0 at the onset of confluence. For clarity, velocity fields are only shown for 6 and 30h. The colormap depicts the local average speed. Colorbar in G. E, Time-averaged orientational field calculated from D (N=1). Vectors and colormap depict local cellular orientation with respect to the x-axis. The amplitude of the vectors corresponds to the coherency (see Methods). F, Mean value of angle 𝜓 between the local orientation and the radial direction over time (N=12). G, Time-averaged flow field calculated from D (N=1). Flow directions are shown as black streamlines. The colormap depicts the local average speed. In E and G, semi-transparent areas enclose a region corresponding to a circle with a radius of 100μm. H, Absolute values of the average azimuthal (vθ) and radial (vr) velocities over time (N=12). I, Time series of myoblast asters (r=100μm) forming cellular mounds. t=t0 at the onset of mound formation. J, Average height of myoblast assemblies with time (N=17, 10, 16, for mounds at 1, 3 and 6 days after the onset of confluence, respectively). In panels B and J, data are presented as mean values +/- SD. In panels F and H, data are presented as mean values +/- SE. Scale bars, 100μm.

