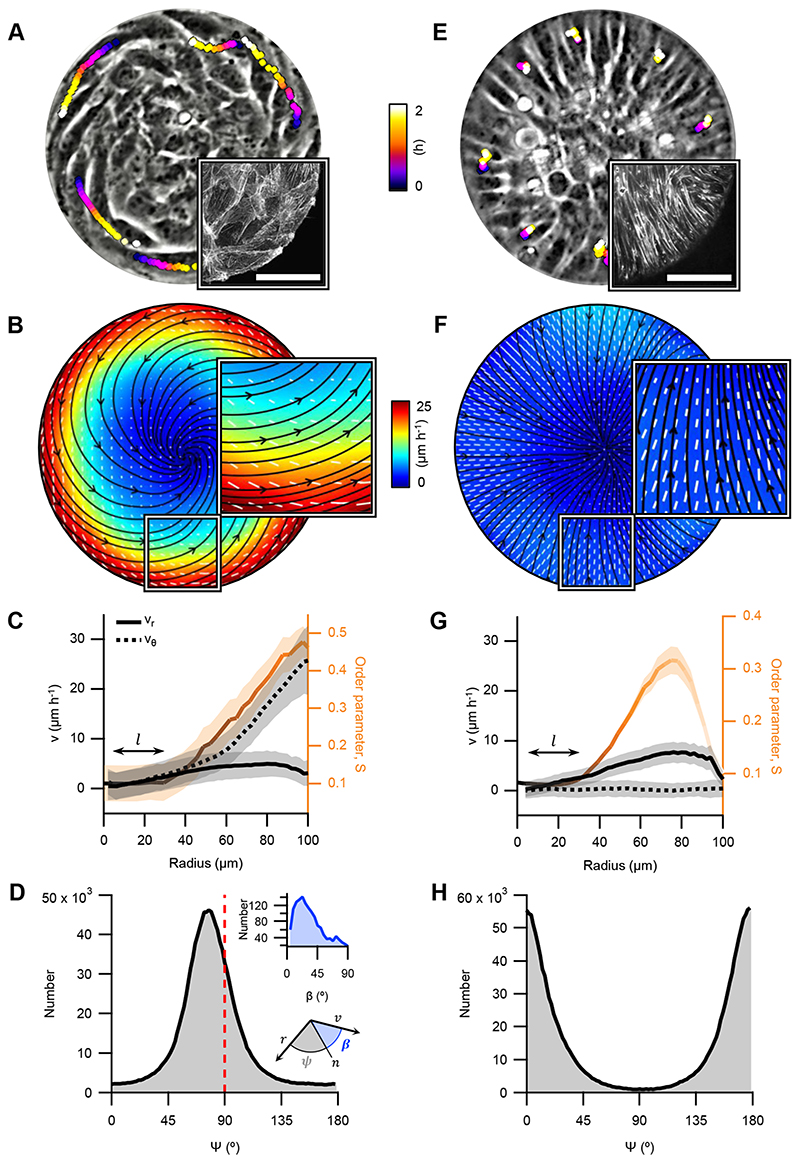
Figure 2. Cellular spiral and aster configurations.
A and E, Phase contrast images of spiral and aster arrangements (r=100μm), respectively. Trajectories of single cells are depicted with color gradients. Colormap represents time. Insets: Confocal image of the actin fibers at the base of a spiral and an aster, respectively. Actin was stained with SiR-actin. Scale bars, 50μm. B and F, Average velocity, and orientation fields. Streamlines indicate the direction of the cellular flows. Colormap represents average speed. White lines indicate local cellular orientation, their length corresponds to the coherency (see Methods). C and G, Radial profiles of the average azimuthal (vθ, dashed black) and radial velocity (vr, solid black) components in absolute values, and the profiles of S (orange). l depicts the size of the defect core. Data are presented as mean values +/- SE. D and H, Distribution of the angle 𝜓. Insets: distribution of the angle β between the velocity and cell orientation calculated from B (D), illustration of the angles 𝜓 and β (H). Panels B, C and D correspond to spirals (N=12), and F, G and H to asters (N=43).

