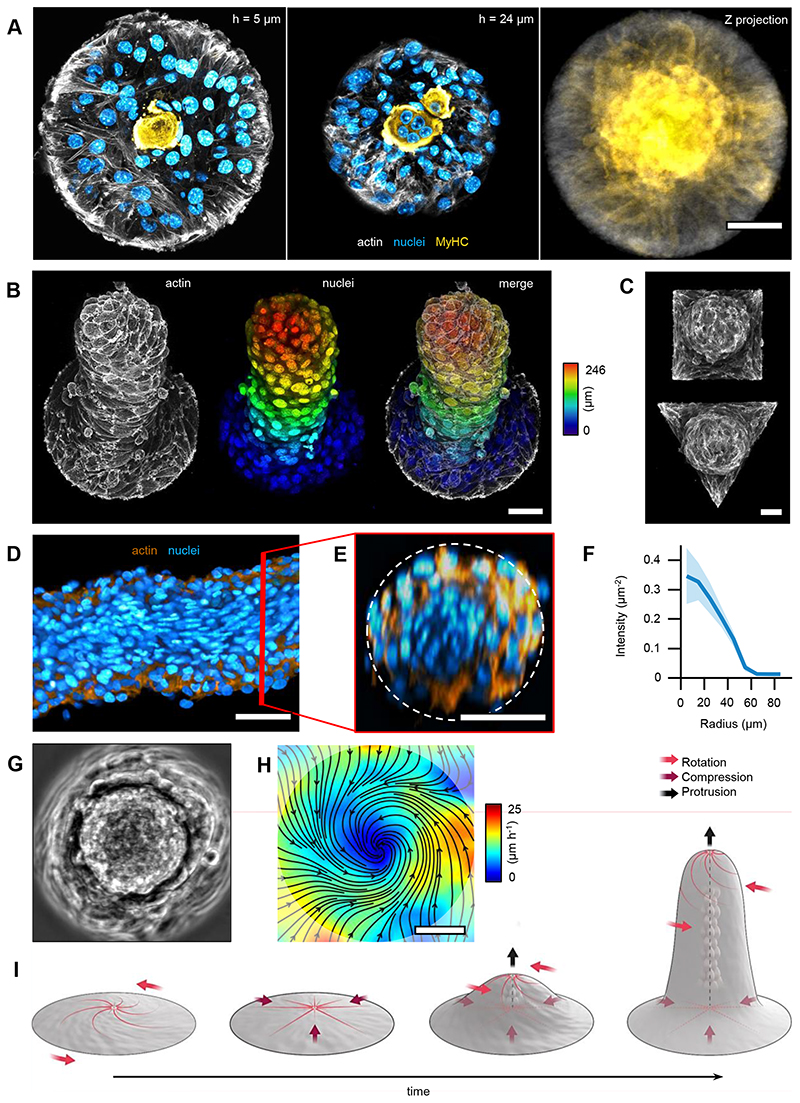
Figure 6. Topological defects organize differentiation and morphogenesis in 3D nematic tissues.
A, Confocal images at different heights (h) showing the preferential position for myosin heavy chain (MyHC) expression. Confinement radius r=100 μm. Left panel corresponds to the first layer of cells. Center panel corresponds to the midplane, displaying a multinucleated myotube-like structure. Right panel shows the projection of MyHC intensity (N=43). B, Z-projection of a 12-days-old cellular protrusion. Colormap indicates height. C, Z-projection of 6-days-old protrusions that were grown on patterns with the same area but different geometries. D, Cross-section of a tilted protrusion along the protrusion long axis, which goes from left to right in the panel. E, Cross-section of the tilted protrusion perpendicular to the protrusion long axis and along the red line in panel D. Dashed line corresponds to a circle of radius r=50μm. F, Radial profile of fluorescence intensity per unit area from the nuclei average along the azimuthal and the main protrusion axis directions for the protrusion in D. Sections were centered prior to extracting the intensity profile (N=191 sections). Data are presented as mean values +/- SD. G, Phase contrast image of top view of a 9-days-old protrusion and H, corresponding average velocity field. Streamlines indicate the direction of the cellular flows. Colormap represents average speed. I, Scheme of the time evolution of cellular nematic architectures from 2D to 3D. Actin was stained with SiR-actin. MyHC was stained with the Myosin-4 Monoclonal Antibody conjugated with Alexa Fluor 488. Nuclei were stained with Hoechst 33342. Scale bars, 50μm.

