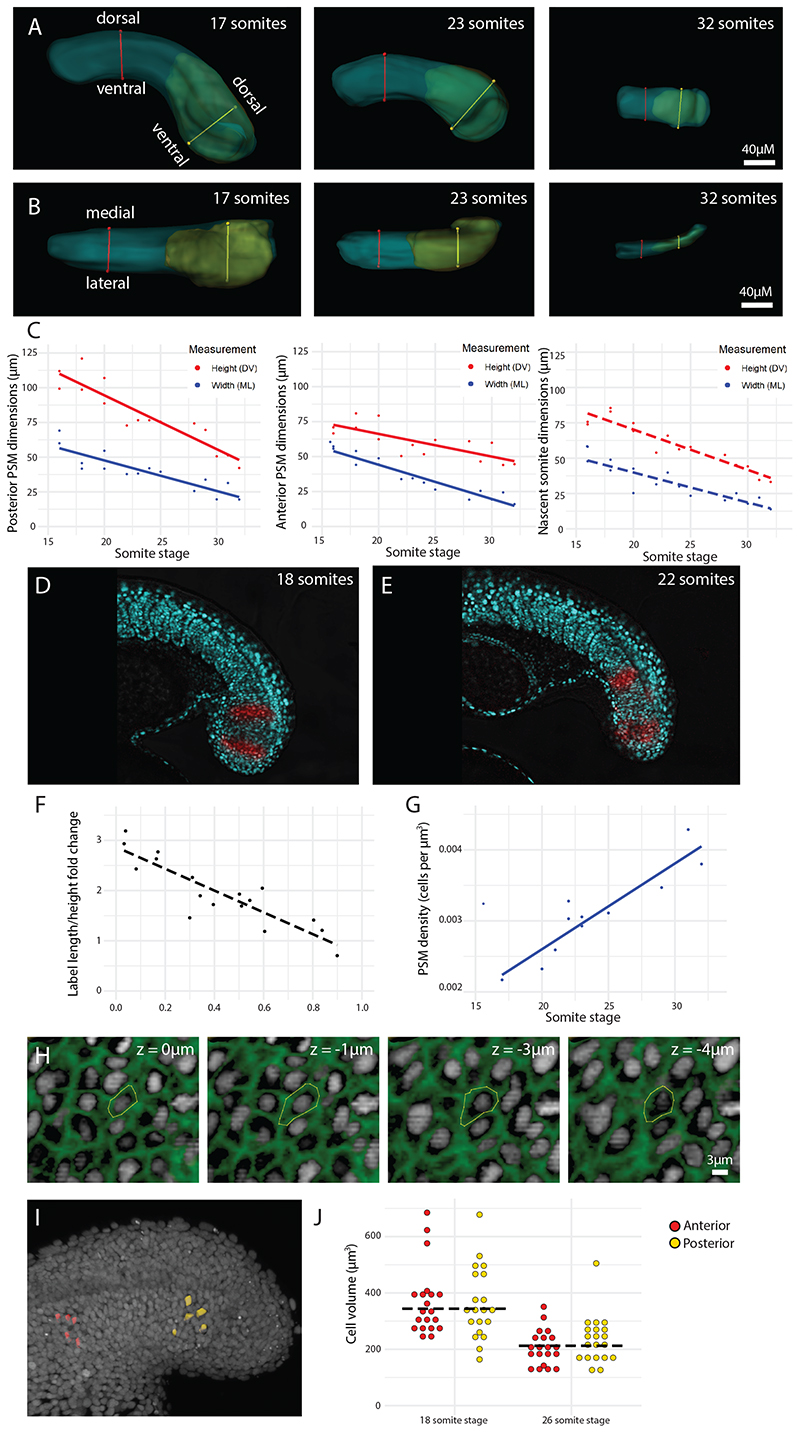
Figure 2. PSM convergence in height and width coincides with an increase in tissue density.
(A-B) Height (DV axis) (A) and width (ML axis) (B) measurements were taken of the posterior PSM (yellow line), anterior PSM (red line), and nascent somite (not shown) from the 16 somite-stage to the end of somitogenesis. (C) All height and width measurements show a decrease over the course of somitogenesis (n = 15 embryos). Solid trendlines indicate genuine change of one tissue (PSM) over time, whereas dotted trendlines indicate a trend based on separate tissues (nascent somites). The trendline equations are as follows (where x is somite stage): posterior PSM height = -3.88x + 172 (R2 = 0.84); posterior PSM width = -2.2x + 91.6 (R2 = 0.77); anterior PSM height = -1.62x + 98.7 (R2 = 0.58); anterior PSM width = -2.45x + 93.1 (R2 = 0.91); nascent somite height = -2.85x + 127 (R2 = 0.89); nascent somite width = -2.12x + 82.4 (R2 = 0.79). (D, E) Using a photoconvertible protein, dorsoventral stripes of cells in the PSM were photolabelled (red) and imaged over four somite-stages (n = 7 embryos). (F) The height and length of each label at the beginning and end of imaging was measured, along with the initial distance of the label from the posterior end of the PSM. These measurements were used to calculate a length/height ratio fold change over time, which is plotted over initial position AP position of the label (normalized from 0 to 1 between embryos, with 0 being the posterior end and 1 being the nascent somite posterior boundary). Dotted trendline equation: y = -2.17x + 2.87 (R2 = 0.78). (G) PSM density (cell number divided by tissue volume) increases over the course of somitogenesis. Trendline equation: y = 0.000121x + 0.000187 (R2 = 0.85). (H) Phalloidin-stained (green) tails of 18 somite-stage and 26 somite-stage embryos were used to measure cell volumes, by drawing contours around the cell membrane at every z-slice (z-interval: 1 μm). This was done for 5 randomly selected posterior cells and 5 randomly selected anterior cells per embryo (n = 10 embryos). (I) 3D reconstructions of posterior (yellow) and anterior (red) PSM cells, generated from manually-drawn contours. (J) Dotplot showing cell volumes between regions and between stages. Cell volumes were obtained from 3D cell reconstructions. Cell volumes are not significantly different between regions (t = -0.36, p = 0.72) but are significantly different between stages (t = 6.39, p < 0.001). The black dotted line represents the mean cell volume for each stage.

