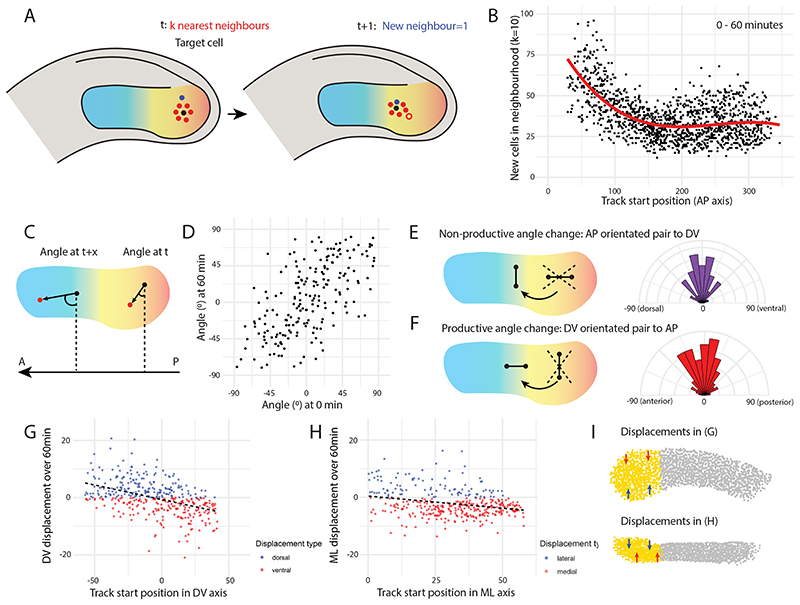
Figure 4. Posterior PSM cells drive convergent extension, but not via directional intercalation.
(A) Analysis of neighbour exchanges. For each paraxial mesoderm cell (black), a neighbourhood was specified as a given number (k) of nearest neighbours (red cells). After a given time interval, the number of new cells (blue) that entered the target cell’s neighbourhood was calculated. In this example, one new cell joins the neighbourhood (k = 6) over time, with the cell that is no longer in the neighbourhood shown in red outline. (B) The number of new cells entering each target cell’s neighbourhood (k = 10) over 60 min is plotted against the initial AP position of the target cell, with 0 being the posterior end of the tail, and ~ 300 being the anterior-most cells. Each point represents a single cell (n = 1,348 cells from one embryo). The results show that more cell mixing occurs in the posterior PSM (C) Analysis of neighbour angle changes. For each posterior PSM cell (black), the angle between the vector to the nearest neighbour (red) and the AP axis was calculated at the initial timepoint (t). After a given time interval (t + x), the same vector angle was calculated between the two cells (regardless of whether they were still neighbours). 0°: cells lie perpendicular to the AP axis. 90°/-90°: cells lie parallel to the AP axis. An angle change from 0° to 90°/-90° would indicate strong directional intercalation of neighbouring cells. (D) Measured neighbour angle changes are shown for 60 min. Each point represents a cell pair (n = 201 cell pairs from one embryo), with the x-axis value providing the initial vector angle and the y-axis value providing the vector angle after 60 min. (E-F) Comparing the distribution of non-productive vs productive angle changes. (E) Those neighbour pairs that initially lay parallel to the AP axis (DV angle > -45° & < 45°) were selected, and the distribution of DV angle changes over 60 min is shown on the right. (F) Those neighbour pairs that initially lay perpendicular to the AP axis (AP angle > -45° & < 45°) were selected, and the distribution of AP angle changes over 60 min is shown on the right. The distributions of angle changes are not significantly different (Two-sample Kolmogorov-Smirnov test: D = 0.069652, p = 0.7141), suggesting that directional intercalation is not occurring. (G-I) Analysis of posterior PSM cell displacements (n = 1,161 cell tracks from one embryo). (G) Strong DV axis convergence over 120 min: dorsal cells (x > 0) move ventrally (y < 0, red) and ventral cells (x < 0) move dorsally (y > 0, blue). y = -0.1x − 0.67 (R2 = 0.2). (H) Weak ML axis convergence over 120 min: lateral cells (high x) move medially (y < 0, red) and medial cells (low x) move laterally (y > 0, blue). y = -0.08x + 0.45 (R2 = 0.08). (I) Schematic summarising displacements of posterior PSM cells (not to scale). Top view is lateral, showing DV convergence. Bottom view is dorsal, showing ML convergence.

