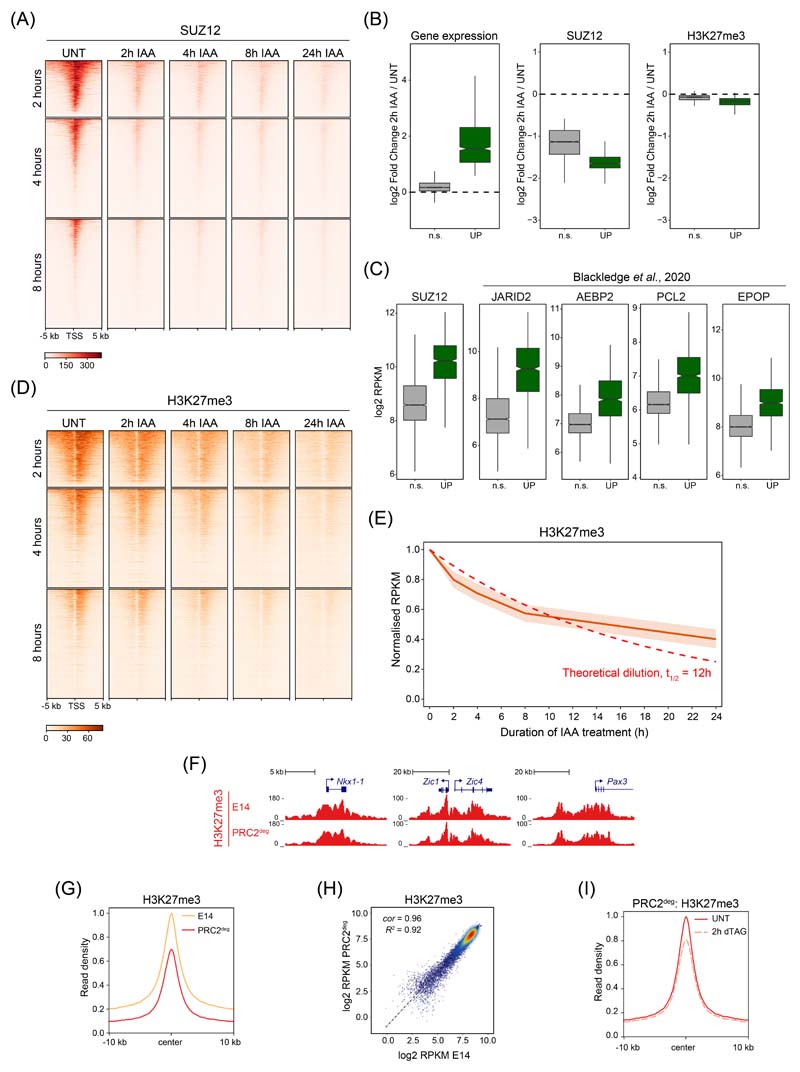
Extended Data Fig. 3. Characterisation of PRC2 and H3K27me3 after PRC1 removal.
(A) Heatmap analysis of SUZ12 cChIP-seq at TSSs for the three groups of genes defined by the earliest time of derepression in PRC1deg cells treated with IAA for the indicated times. Heatmaps are sorted by RING1B cChIP-seq signal in untreated cells.
(B) Boxplots illustrating log2 fold changes in expression (cnRNA-seq, left panel), SUZ12 cChIP-seq signal (middle) or H3K27me3 cChIP-seq signal (right) at promoters (TSS ± 2.5 kb) of Polycomb target genes showing a significant reduction in SUZ12 levels following 2 hours of IAA treatment. Log2 fold changes are derived from n=3 biologically independent experiments. Genes are divided into Polycomb target genes that become derepressed (UP, n = 955) and those that do not change in expression (n.s., n = 3739) by 2 hours. SUZ12 binding was reduced in both groups, while H3K27me3 levels were only modestly affected. Boxes show interquartile range, center line represents median, whiskers extend by 1.5x IQR, while notches extend by 1.58x IQR/sqrt(n), giving a roughly 95% confidence interval for comparing medians.
(C) Boxplots comparing the promoter (TSS ± 2.5 kb) cChIP-seq signal of PRC2 components for the two groups of genes defined in (B), in the wild-type state. Polycomb target genes derepressed after 2 hours of PRC1 depletion are characterised by high levels of PRC2 components, in agreement with this group of genes being highly enriched in Polycomb chromatin domain features. SUZ12 cChIP-seq data is from this study (PRC1deg cells), while JARID2, AEBP2, PCL2 and EPOP are from 30. Read coverages represent merged spike-in normalised values from n=3 biologically independent experiments. Boxplots are defined as in (B).
(D) As in (A) but for H3K27me3 cChIP-seq.
(E) The dynamics of reduction in H3K27me3 cChIP-seq signal at RING1B-bound sites which show a significant reduction in H3K27me3 levels by 24 hours of IAA treatment (n = 5926). Central line represents median, with interquartile range shown as shaded area. A theoretical exponential decay function is shown as dashed line, assuming that H3K27me3 levels are halved with every cell cycle if maintenance is completely disrupted. The doubling time of mouse ESCs is approximately 12 hours.
(F) Genomic snapshots of typical Polycomb target genes showing cChIP-seq signal for H3K27me3 in wild-type (E14) and PRC2deg cells before dTAG-13 treatment.
(G) Metaplot analysis of H3K27me3 cChIP-seq at RING1B-bound sites in wild-type (E14) and PRC2deg cells before dTAG-13 treatment. Maximal read density in E14 cells was set to 1.
(H) A scatterplot showing the relationship between H3K27me3 cChIP-seq signal at RING1B-bound sites in wild-type (E14) and PRC2deg cells before dTAG-13 treatment. R2 is the coefficient of determination for linear regression and cor is Pearson correlation coefficient.
(I) Metaplot analysis of H3K27me3 cChIP-seq at RING1B-bound sites in PRC2deg cells before and after 2h dTAG-13 treatment. Maximal read density in untreated cells was set to 1.

