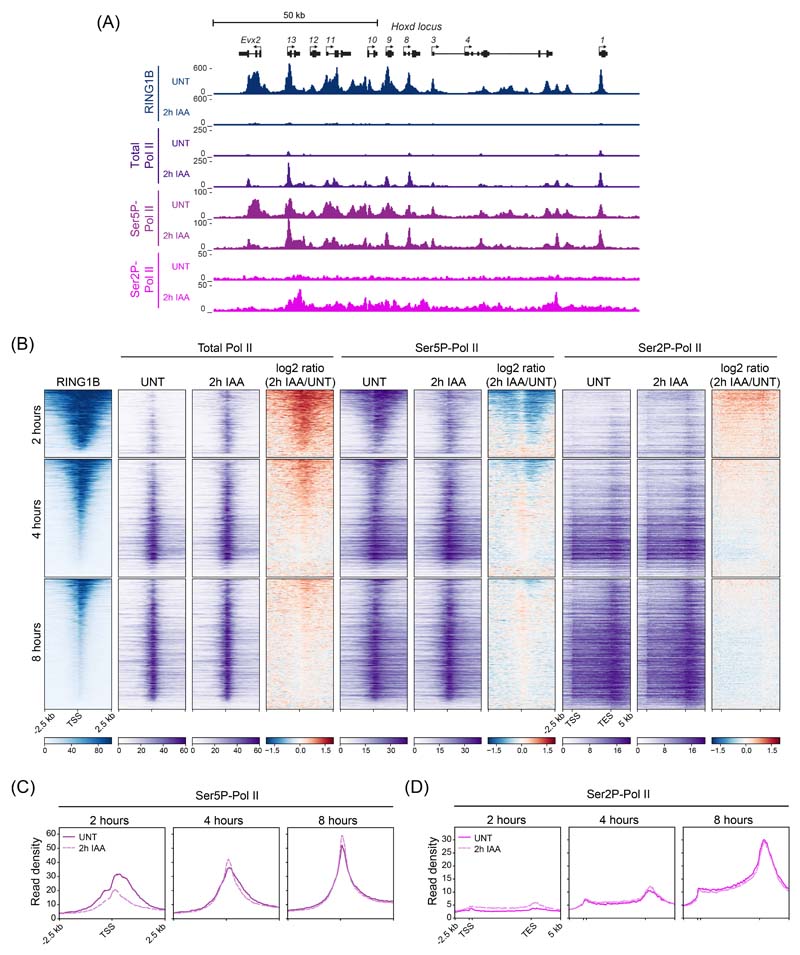
Extended Data Fig. 5. Effects on Pol II phosphorylation state after PRC1 removal.
(A) Genomic snapshot of Hoxd locus showing cChIP-seq signal for RING1B, total Pol II, Ser5P-Pol II and Ser2P-Pol II in untreated PRC1deg cells and 2 hours after IAA addition.
(B) Heatmaps illustrating RING1B, total Pol II, Ser5P-Pol II and Ser2P-Pol II levels and changes in polymerase occupancy following 2h of IAA treatment for three groups of genes defined by the earliest time of derepression. Heatmaps are sorted by RING1B signal in untreated cells.
(C) Metaplot analysis of Ser5P-Pol II cChIP-seq at promoters of the three groups of genes defined by the earliest time of derepression in untreated PRC1deg cells and 2 hours after IAA addition. The profiles represent the median signal over the shown genomic region.
(D) As in (C) but for Ser2P-Pol II cChIP-seq over gene bodies.

