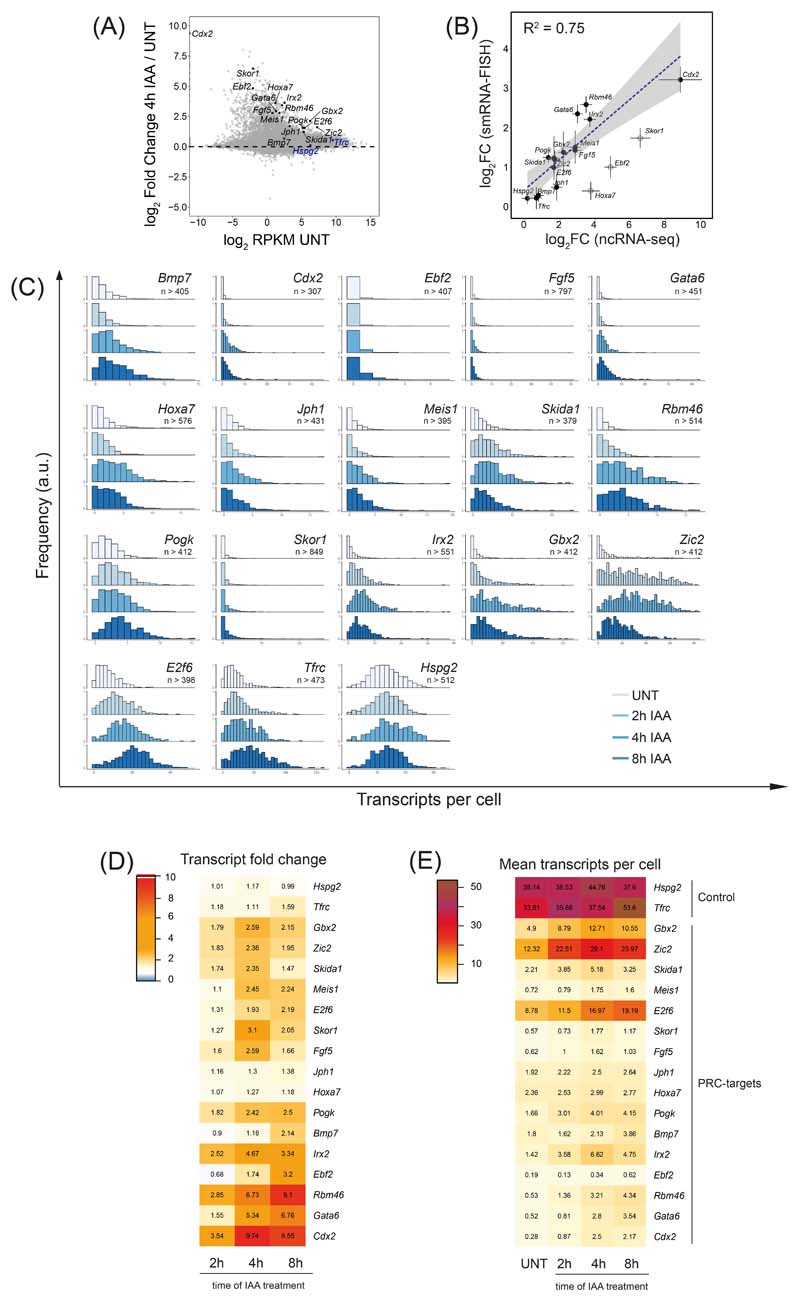
Extended Data Fig. 7. Effects on absolute transcript numbers in single cells after PRC1 removal.
A) An MA plot depicting gene expression (cnRNA-seq) changes following 4h IAA treatment in PRC1deg cells with candidate genes for smRNA-FISH highlighted. The genes chosen span a wide range of initial transcript levels and transcript increase upon RING1B removal. The control genes are highlighted in blue and Polycomb target genes in black.
B) Correlation of log2 fold changes between cnRNA-seq and smRNA-FISH after 4 hours of IAA treatment. Hollow dots represent genes excluded from the linear fit. Dots represent mean values while error bars represent standard error of 3 biological replicates.
C) Normalised histograms illustrating the distribution of transcripts per cell over the time course of RING1B removal for all genes studied with smRNA-FISH. Shown is a representative biological replicate of 3 independent experiments. n indicates minimum number of cells measured at any given time-point per gene dataset.
D) A heatmap of mean fold changes in transcripts per cell over the time course of RING1B removal. Numbers represent the mean of 3 biological replicates.
E) As in (D) but representing the mean number of transcripts per cell.

