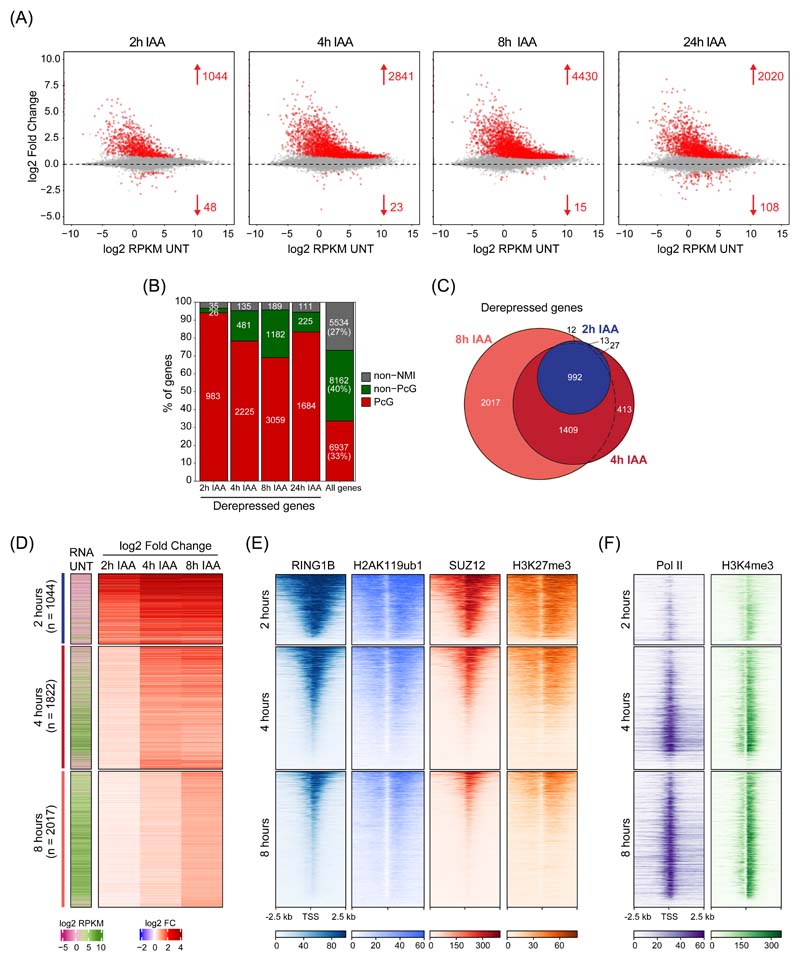
Figure 2. Perturbing PRC1 has immediate effects on gene expression.
(A) MA plots depicting gene expression changes in PRC1deg cells treated with IAA for the indicated times relative to untreated cells. Differentially expressed genes (padj < 0.05, fold change > 1.5) are labelled in red.
(B) Distribution of different gene classes among genes with increased expression at different times following IAA treatment. Non-NMI, genes lacking a non-methylated CGI; Non-PcG, non-Polycomb-occupied genes; PcG, Polycomb-occupied genes.
(C) A Venn diagram showing the overlap between significantly derepressed genes identified after treating cells with IAA for the indicated times.
(D) Heatmaps depicting gene expression (cnRNA-seq) in untreated cells and changes following IAA treatment for the three groups of genes defined by the earliest time of derepression. Heatmaps are sorted by RING1B cChIP-seq signal as in (E).
(E) Heatmaps showing cChIP-seq signal for Polycomb chromatin domain features (RING1B, H2AK119ub1, SUZ12, and H3K27me3) in untreated cells, at promoters of the gene groupings in (D). Heatmaps are sorted by RING1B cChIP-seq signal.
(F) As in (E) but for total Pol II and H3K4me3 cChIP-seq.

