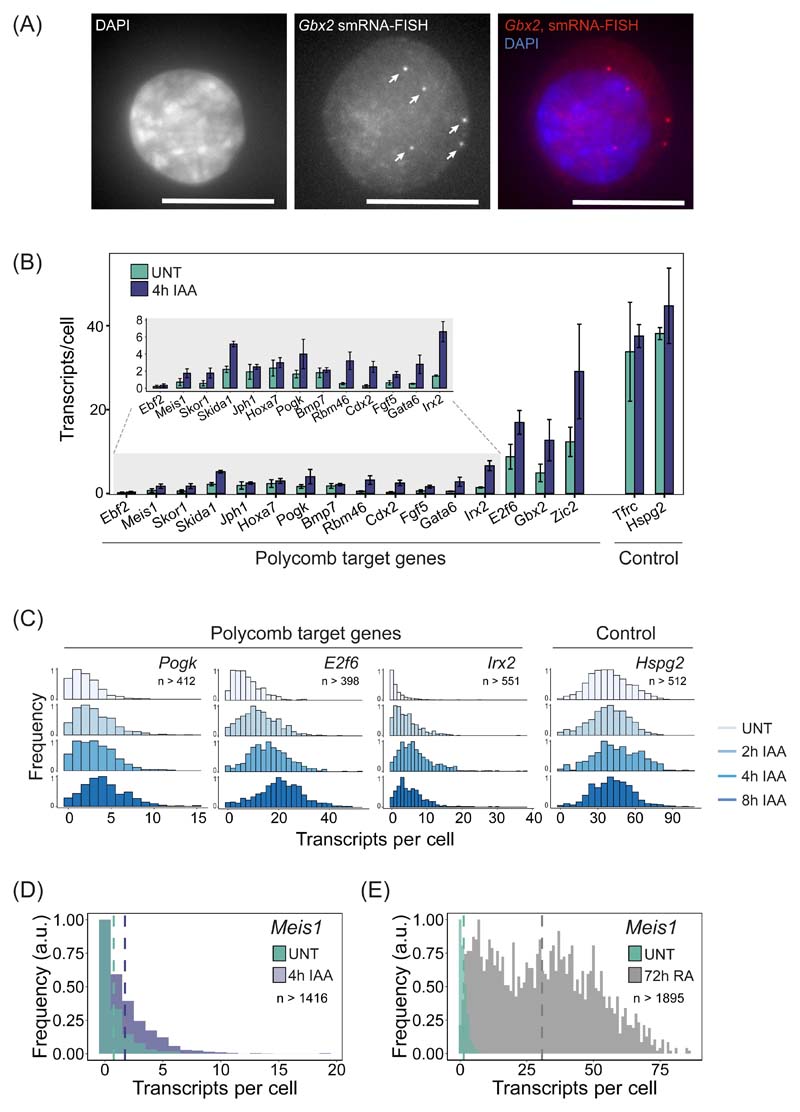
Figure 6. Single-cell analysis of Polycomb target gene expression.
(A) A smRNA-FISH image of the Polycomb target gene Gbx2. Individual dots indicated with arrows correspond to single transcripts of Gbx2. DAPI is shown to indicate the nucleus (left panel). Maximal projections of 3D stacks are presented and the scale bar corresponds to 10 μm.
(B) A bar graph illustrating the mean number of transcripts per cell in PRC1deg cells before and after 4 hours of IAA treatment to remove PRC1 for 16 Polycomb target genes and two control genes. Data represents mean (n=3) ± SD.
(C) Normalised histograms illustrating the distribution of transcripts across the cell population in PRC1deg cells treated with IAA for the indicated times for selected Polycomb target genes and a control gene (n indicates minimum number of cells measured at any given time-point per gene dataset). All analysed genes are shown in Extended Data Fig. 7C.
(D) As in (C) but for Meis1 in untreated PRC1deg cells and after 4 hours of IAA treatment to remove PRC1. The vertical dashed lines correspond to the mean value of transcripts per cell for the respective condition.
(E) As in (D) but for Meis1 in untreated ESCs and after 72 hours of retinoic acid treatment (RA).

