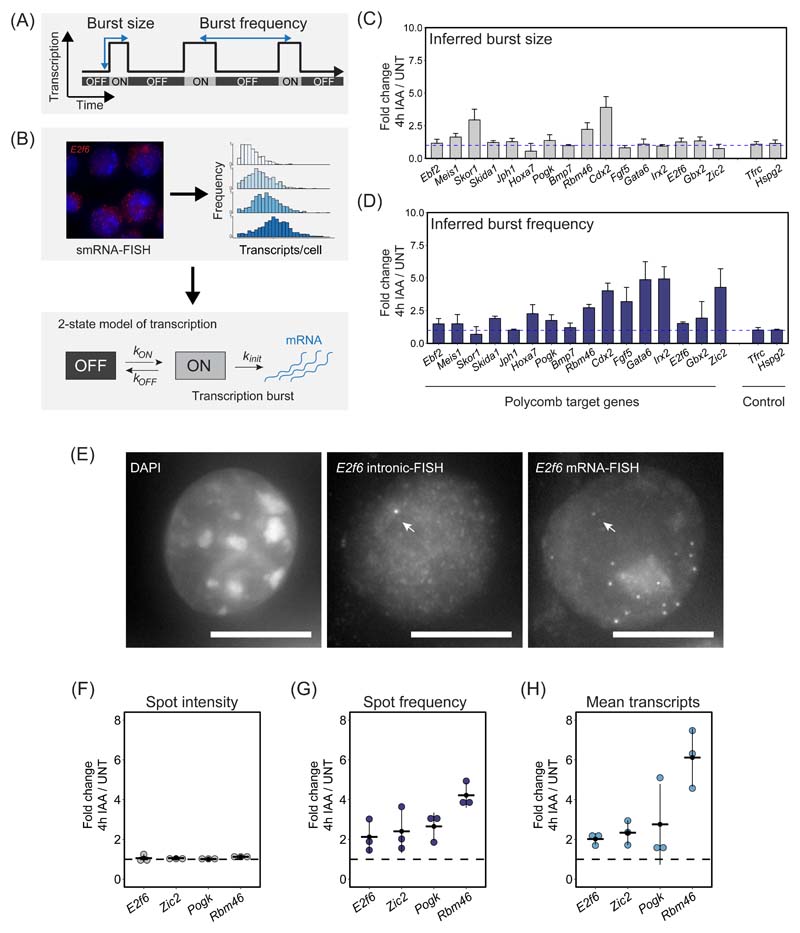
Figure 7. The Polycomb system represses gene expression by limiting transcription burst frequency.
(A) A schematic illustrating the stochastic and pulsatile nature of gene transcription. Over time, a gene promoter can exist in an OFF state where no transcription is occurring or ON state where multiple transcripts are produced (a burst of transcription). The number of transcripts that are produced in a burst is referred to as the burst size and the burst frequency is the time between transcription bursts. Importantly, transcription burst sizes and their frequency are central determinants of gene expression.
(B) A schematic illustrating how population level transcript distributions from smRNA-FISH are used to inform a two state model of transcription and infer kinetic parameters of transcription.
(C) A bar graph illustrating the fold change in inferred transcription burst size for Polycomb target and control genes. Data represents mean (n=3) ± SD. The dashed horizontal line corresponds to no change.
(D) As in (C) but for inferred burst frequency.
(E) An example of a nascent smRNA-FISH (intronic FISH) image for E2f6, with an individual bright dot corresponding to a nascent transcription spot indicated with an arrow (middle panel). Standard smRNA-FISH (targeting exonic sequences) in the same cells illustrates individual transcripts and the nascent transcription spot (right panel). DAPI is shown to indicate the nucleus (left panel). The scale bar corresponds to 10 μm.
(F) Fold change in mean nascent transcription spot intensity for the indicated Polycomb target genes following 4h IAA treatment to remove PRC1. The dashed horizontal line corresponds to no change. Individual biological replicates are represented by dots, whereas the horizontal line represents the mean of the 3 biological replicates. A minimum of 887 cells was measured per biological replicate.
(G) As in (F) but fold change in nascent transcription spot frequency.
(H) As in (F) but fold change in the mean number of transcripts per cell.

