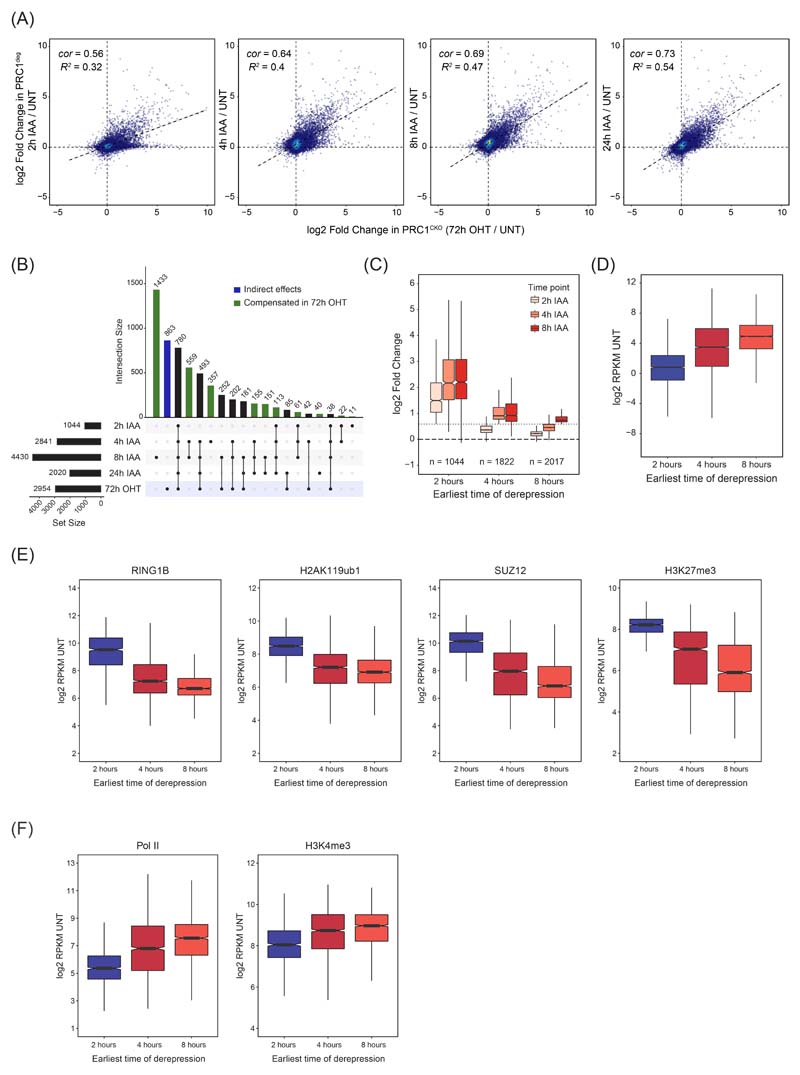
Extended Data Fig. 2. Expression and chromatin features of genes derepressed after PRC1 removal.
(A) Scatterplots comparing the log2 fold changes in gene expression (cnRNA-seq) at different time points after auxin treatment in PRC1deg cells with gene expression changes in PRC1CKO (72h OHT) cells. R2 is the coefficient of determination for linear regression and cor is Pearson correlation coefficient.
(B) An UpSet plot for genes with significantly increased expression (p-adj < 0.05, fold change > 1.5) following auxin treatment of PRC1deg cells at the indicated time points, or a 72h OHT treatment of PRC1CKO cells. The total number of genes in each set is shown in the bar chart on the left. Non-empty intersections were sorted by size, while excluding any intersection with less than 10 members for clarity. Intersections not included in the PRC1CKO (72h OHT) set are highlighted in green and may imply compensatory effects on expression, while the blue column denotes gene changes exclusive to the PRC1CKO and could correspond to secondary effects on expression.
(C) Boxplots comparing the log2 fold changes in expression of genes split into three groups based on the earliest time point when they became derepressed. Log2 fold changes are derived from n=3 biologically independent experiments. Dotted line represents 1.5-fold change. Boxes show interquartile range, center line represents median, whiskers extend by 1.5x IQR, while notches extend by 1.58x IQR/sqrt(n), giving a roughly 95% confidence interval for comparing medians.
(D) Boxplots comparing the gene expression levels in the untreated PRC1deg cells for the three groups of derepressed genes defined in (B). RPKM values represent mean of n=3 biologically independent experiments. Boxplots are defined as in (C).
(E) Boxplots comparing the promoter (TSS ±2.5 kb) cChIP-seq signal for RING1B, H2AK119ub1, SUZ12 and H3K27me3 in the untreated PRC1deg cells for the three groups of derepressed genes defined in (B). Read coverages represent merged spike-in normalised values from n=3 biologically independent experiments. Boxplots are defined as in (C).
(F) Boxplots comparing the promoter (TSS ± 2.5 kb) cChIP-seq signal for total Pol II and H3K4me3 in the untreated PRC1deg cells for the three groups of derepressed genes defined in (B). Read coverages represent merged spike-in normalised values from n=3 biologically independent experiments. Boxplots are defined as in (C).

