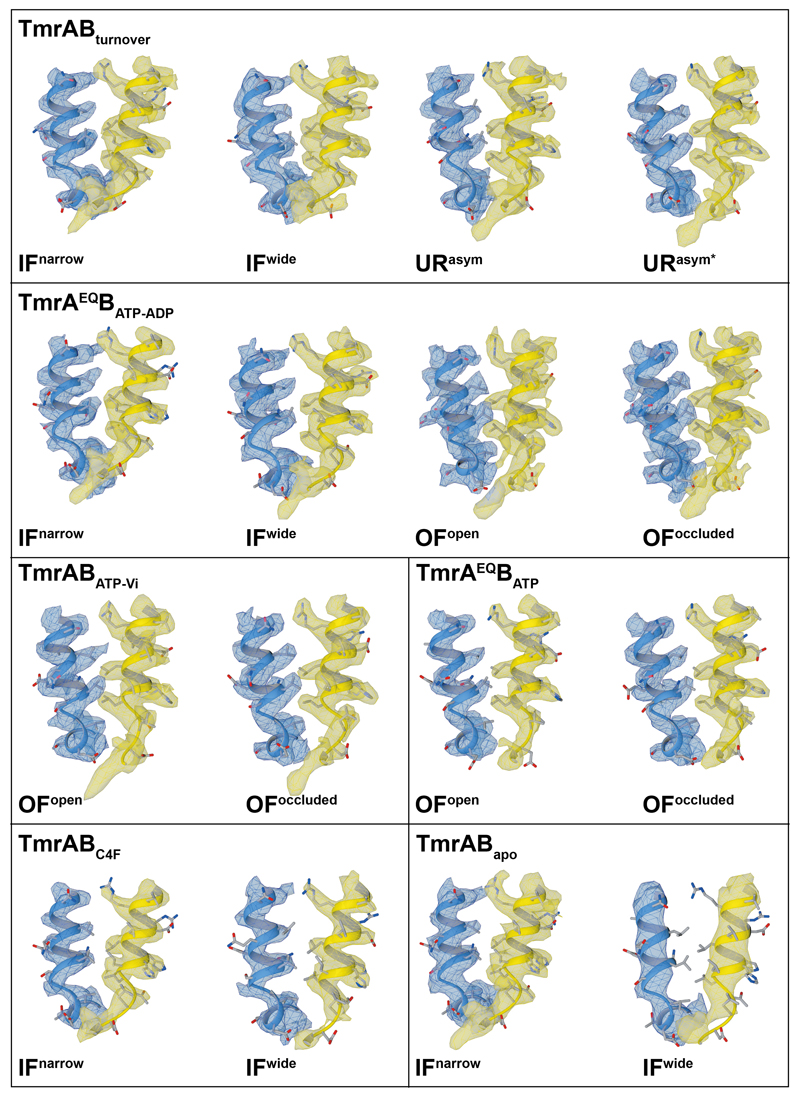
Extended Data Figure 6. Map quality.
To demonstrate the quality of each map, a selected region, spanning residues 213-235 of TmrA and 94-106 of TmrB, was extracted from each corresponding experimental map. All maps display clear side-chain densities, except for the IFwide map of the TmrABapo control, which is also the smallest dataset in size.

