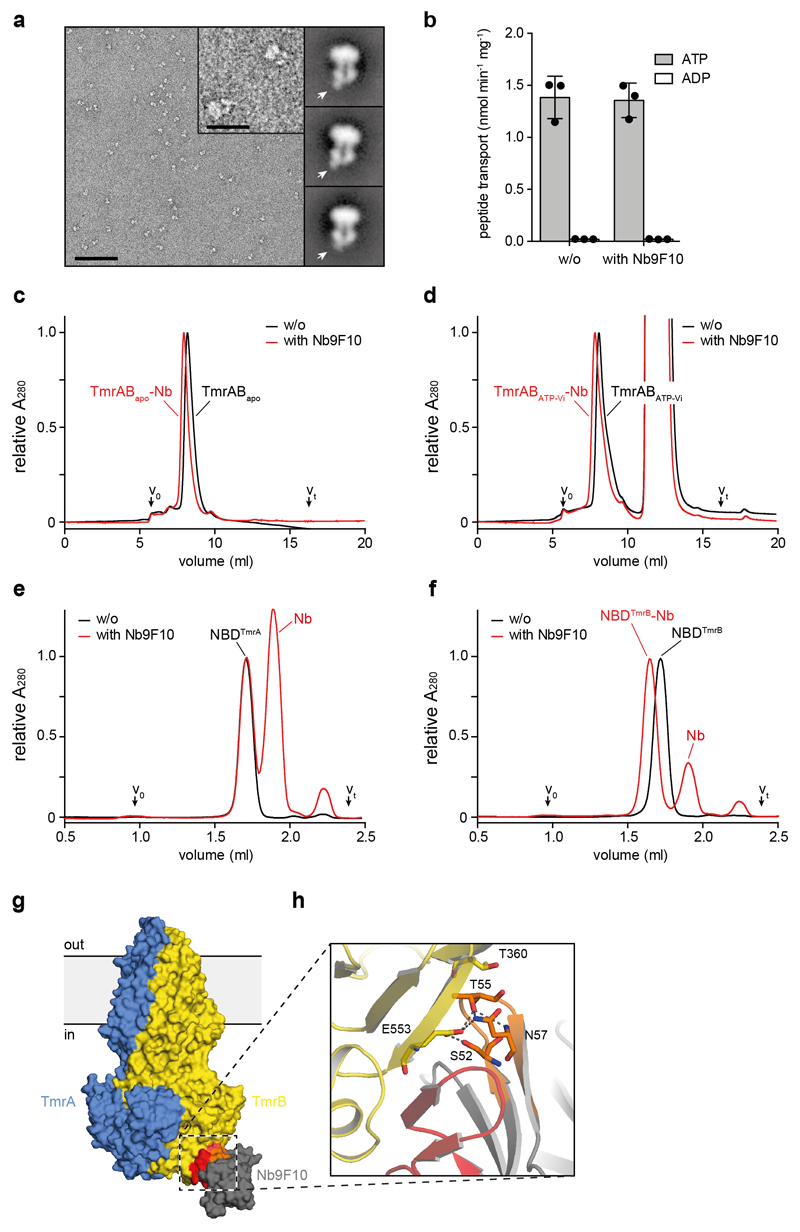
Extended Data Figure 2. TmrAB-nanobody interaction.
a, Expanded view of a representative negative-stain raw micrograph and 2D class averages of TmrAB-Nb complexes. In the 2D class averages, note the clear density for Nb9F10 bound to the intracellular side of TmrAB. The scale bar is 100 nm in the micrograph and 25 nm in the inset (magnified 4x). b, Peptide transport of TmrAB in proteoliposomes with and without addition of Nb9F10. Proteoliposomes were incubated with Nb9F10 (100 nM) for 15 min on ice and peptide import into proteoliposomes was subsequently followed for 8 min at 45 °C, mean ± SD from three experiments. c and d, Nb9F10 binds the apo (c) and vanadate-trapped (d) TmrAB. Data are normalized to apo TmrAB without Nb. Column: TSKgel G3000SWXL. e and f, Nb9F10 forms a stable complex with NBD of TmrB (f), but not TmrA (e). In order to illustrate stoichiometric binding, data were normalized to the NBDTmrA chromatogram without Nb. Column: Superdex 200 Increase 3.2/300. g, Surface representation of TmrAB and Nb9F10 colored as in Fig. 1. CDR2 and CDR3 are indicated by orange and red, respectively. h, Close-up view of the TmrAB-Nb9F10 interface, colored as in g. Polar interactions include a short β-sheet between the CDR3 loop and a β-strand of the NBD, as well as several residues of CDR2, which are shown as sticks.

