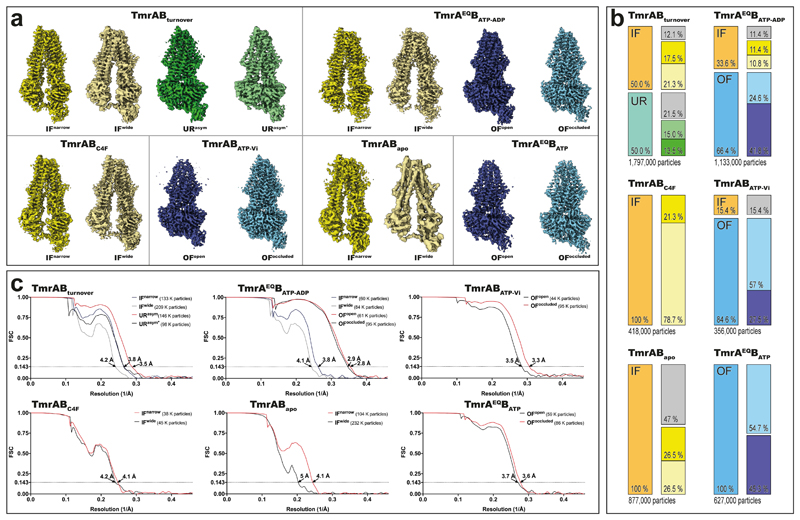
Extended Data Figure 3. Cryo-EM densities and conformational distribution from all datasets.
a, Final maps from all datasets. In all cases, at least two conformations were observed, in accordance with the highly dynamic nature of the transporter. b, Particle distribution in each dataset. The first column represents the total amount of particles after two rounds of 3D classification to remove false positives. At this stage, the main OF and IF conformations were already distinguishable (IF particles, orange; OF, blue; UR, teal; also see Extended Data Fig. 5); however, no safe assignment about the sub-conformation could be made. The second column represents the distribution of each specific conformation after further sub-classification. Color code as in a (the two URasym conformations are colored in light and dark green, poor-quality particles in grey). c, FSC curves for all maps in each dataset, along with the number of particles used during the final refinement.

