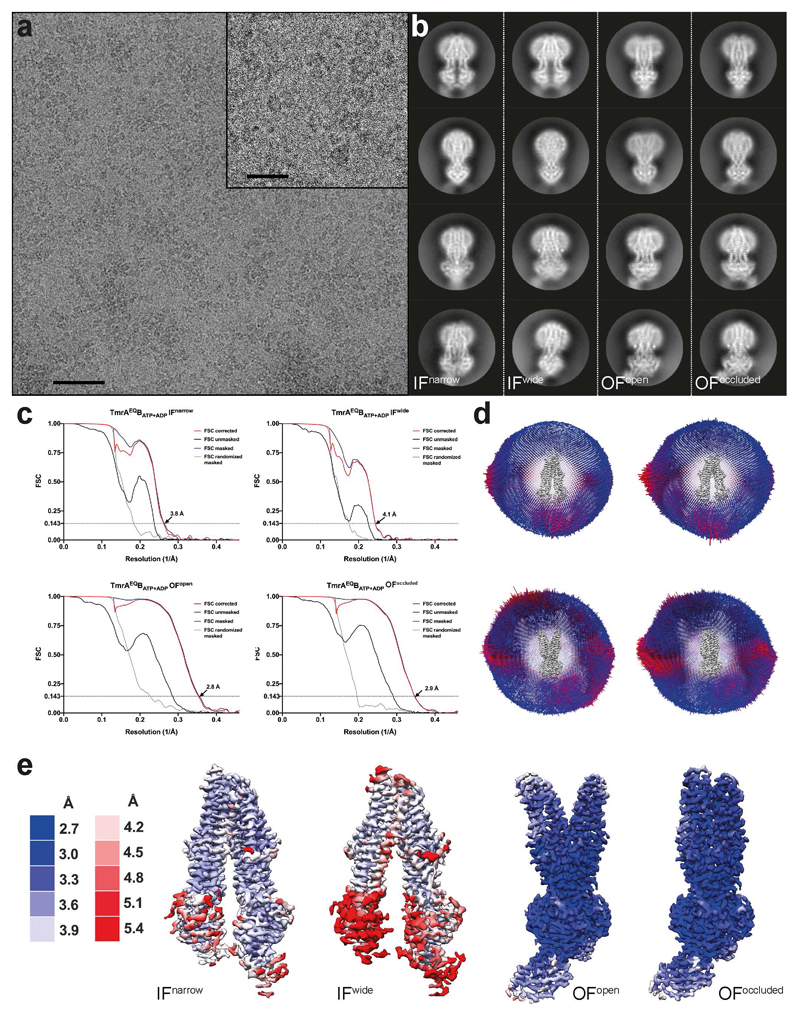
Extended Data Figure 4. Cryo-EM analysis of TmrAEQBATP-ADP.
a, Typical cryo-EM micrograph. Scale bars, 50 nm in the micrograph and 20 nm in the zoom-in. b, Representative 2D class averages for each conformation, observed in the dataset. c, Fourier shell correlation (FSC) curves, generated in RELION-3, for all TmrAEQBATP-ADP maps. d, Angular assignment for each map. The height of individual cylinder bars is proportional to the number of particles in each view. The most frequent views are colored in red. e, Local resolution estimation for the four densities as estimated in CryoSPARC.

