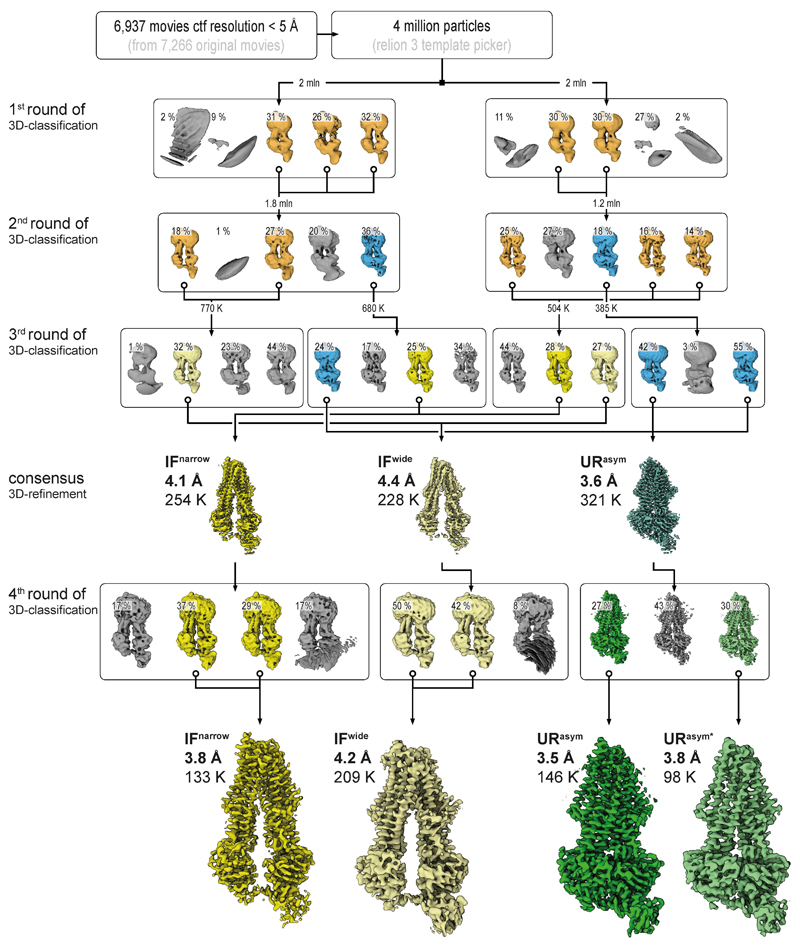
Extended Data Figure 5. Image processing workflow for TmrABturnover.
From 7,266 original motion-corrected movies, 6,937 micrographs, containing signal better than 5 Å (with the majority around 3.5 Å) as estimated by Gctf35, were used in processing. Four million particles were generously auto picked in RELION-3 using 2D templates, extracted at a box size of 64 pixels with 4.3 Å/pixel and directly subjected to multi-model 3D classification to eliminate false positives. To speed up the calculations and overcome large memory demands, the stack was divided into two subsets, containing two million particles each, which were processed in parallel. All maps that reached 8.6 Å resolution (Nyquist for the binned data) were kept (orange) and the corresponding particles were re-centered, re-extracted at full pixel size and subjected to a second round of 3D classification. The selected IF (orange) and URasym (blue) particles were further subclassified. The resulting IFwide, IFnarrow, and URasym particles were pooled and each conformation was refined separately. Particles were polished and ctf refined as implemented in RELION-3, resulting in 4.4 Å, 4.1 Å, and 3.6 Å maps, respectively. Despite the overall high-quality of the obtained densities, visual inspection still revealed significant anisotropy in the resulting volumes. We interpreted this as the result of remaining conformational variance and therefore re-classified the individual stacks to sort out conformational flexibility. To do this, the refined URasym particles were subjected to a fourth round of 3D classification with no alignment, which revealed two different URasym conformations. Both conformations were further refined using non-uniform refinement in CryoSPARC36, resulting in 3.5 Å and 3.8 Å resolution maps for URasym and URasym*, respectively (shown in green). In parallel, IF particles were subjected to heterogenous refinement, followed by non-uniform refinement in CryoSPARC, which further improved the resolution to 3.8 and 4.2 Å for IFnarrow and IFwide, respectively. Color code as in Extended Data Fig. 4. Processing workflows for all other datasets followed the same scheme with only minor modifications at the last steps of 3D classification.

