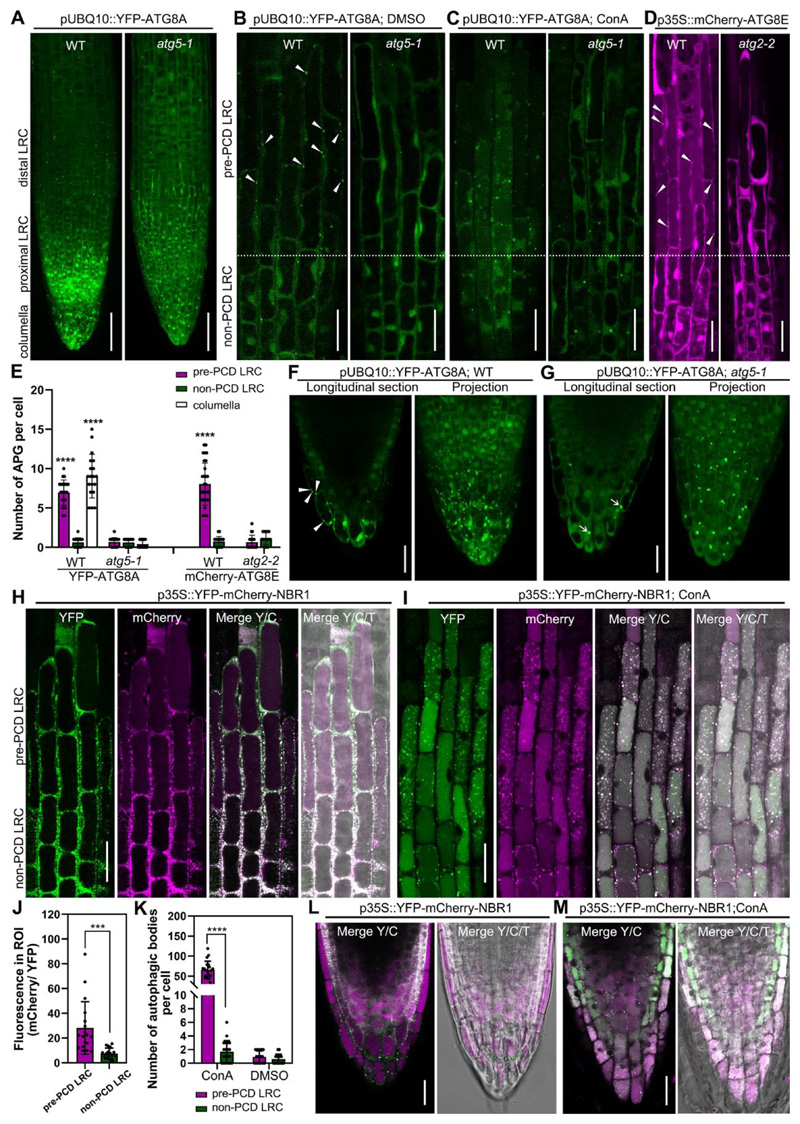
Figure 1. Visualization of the dynamics of autophagosomes/autophagy-related structures in root cap cells.
(A-C) Confocal laser scanning micrograph (CLSM) of lateral root cap (LRC) cells from seedlings at 4 days after germination (DAG) expressing pUBQ10::YFP-ATG8A in wild type and atg5-1 mutant, projection of the root tip (A), longitudinal section of LRC cells treated with DMSO as control (B), or treated with 1 μM ConA for 8 h (C). Scale bars are 50 μm (A), 20 μm (B-C).
(D) CLSM of LRC cells from 4 DAG seedlings of expressing p35S::mCherry-ATG8E in wild type and atg2-2 mutant. Scale bars are 20 μm.
(E) Quantification of autophagosomes (APG) in LRC and columella cells. Results are means ± SD. N = 18-30 cells from 5 roots. **** indicates a significant difference (t test, P < 0.0001).
(F-G) CLSM of columella cells from 4 DAG seedlings expressing pUBQ10::YFP-ATG8A in wild type (F) and atg5-1 mutant (G). Scale bars are 20 μm. White arrow heads indicate autophagosomes, white arrows indicate YFP aggregates.
(H-I) CLSM of LRC cells from 4 DAG seedlings expressing p35S::YFP-mCherry-NBR1 in wild type (H), treated with 1 μM ConA for 8 h (I). Scale bars are 20 μm.
(J) Quantification of the vacuolar import of NBR1 in LRC cells as shown in (H). Quantification was performed by dividing the average gray value in cytosol (YFP) with the average gray value in the vacuole (mCherry), using split channel images in ImageJ. Results are means ± SD. N = 18 cells from 5 roots. *** indicates a significant difference (t test, P < 0.001).
(K) Quantification of autophagic bodies in LRC cells treated with 1 μM ConA for 8 h as shown in (I). Results are means ± SD. N = 15-20 cells from 5 roots. **** indicates a significant difference (t test, P < 0.0001).
(L-M) CLSM of columella cells from 4 DAG seedlings expressing p35S::YFP-mCherry-NBR1 in wild type (L), treated with 1 μM ConA for 8 h (M). Scale bars are 20 μm.
Y/C indicates merge of the YFP channel and the mCherry channel; Y/C/T indicates merge of the YFP channel, the mCherry channel, and the transmission channel.

