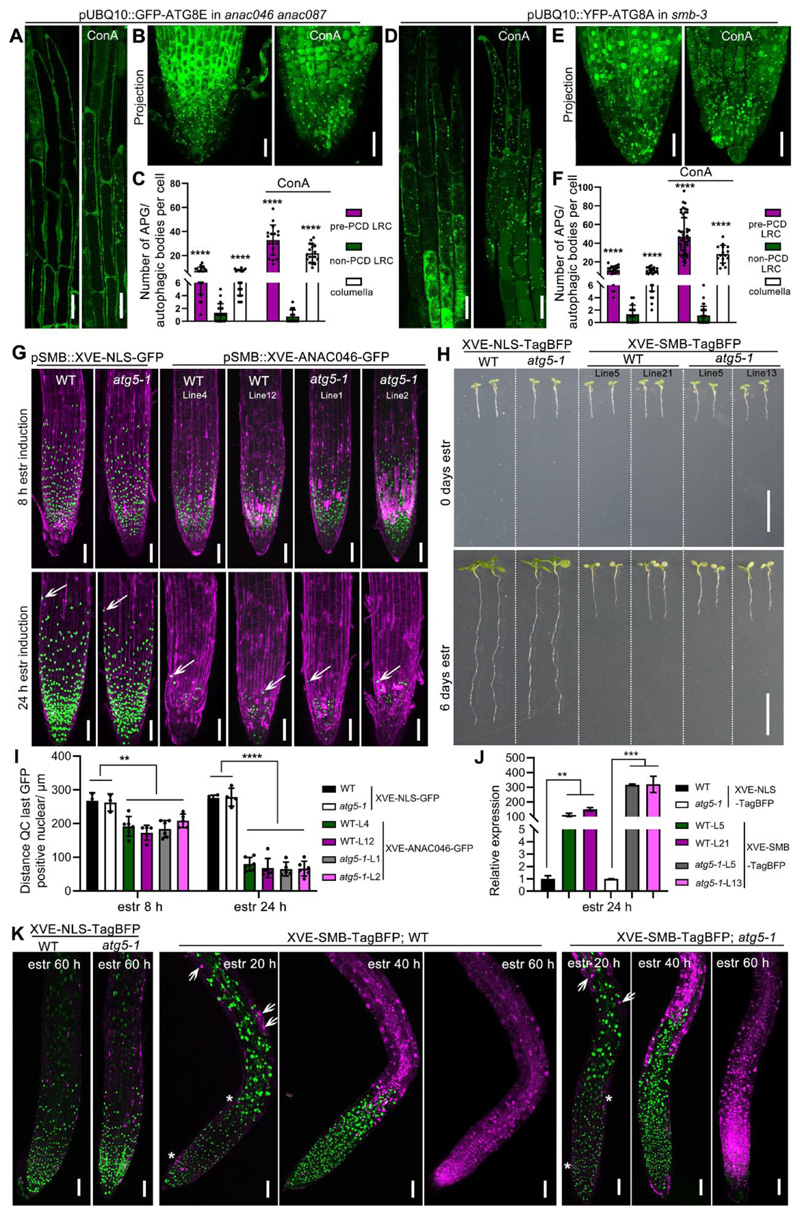
Figure 3. Autophagy occurs independently of established dPCD gene regulatory networks.
(A-C) CLSM of LRC cells from 5 DAG seedlings expressing pUBQ10::GFP-ATG8E in anac046 anac087 mutant, longitudinal section of LRC cells (A, left panel), treated with 1 μM ConA for 8 h (A, right panel), projection of root tip (B, left panel), treated with ConA for 8 h (B, right panel). Scale bars are 20 μm. C, Quantification of autophagosomes (APG) or autophagic bodies in LRC and columella cells shown in (A-B). Results are means ± SD. N = 16-22 cells from 6 roots. **** indicates a significant difference (t test, P < 0.0001).
(D-F) CLSM of LRC cells from 5 DAG seedlings expressing pUBQ10::YFP-ATG8A in smb-3 mutant, longitudinal section of LRC cells (D, left panel), treated with 1 μM ConA for 8 h (D, right panel), projection of root tip (E, left panel), treated with ConA (E, right panel). Scale bars are 20 μm. F, Quantification of autophagosomes (APG) or autophagic bodies in LRC and columella cells shown in (D-E). Results are means ± SD. N = 20-50 cells from 6 roots. **** indicates a significant difference (t test, P < 0.0001).
(G) CLSM of root tips from 5 DAG seedlings pSMB::XVE-NLS-GFP in wild type, in atg5-1, and pSMB::XVE-ANAC046-GFP in wild type and atg5-1 mutant. Two independent lines are shown, stained with PI (magenta). 8 h after estradiol induction (z-stack projection, up row), 24 h after estradiol induction (z-stack projection, down row). White arrows indicate the position of the last living root cap cells. Scale bars are 50 μm.
(H) Macroscopic appearance of estradiol-induction of SMB-TagBFP driven by promoter of pH3.3/HTR5 in wild type and atg5-1 mutant, estradiol-induction of NLS-TagBFP in wild type or atg5-1 mutant as control. Two independent lines are shown at 0 day (upper row) and 6 days (bottom row) after transfer to estradiol-containing medium. Overexpression of SMB resulted in root growth arrest in atg5-1 mutants similar to in the wild type, while the overexpression of NLS-TagBFP did not result in root growth arrest both in atg5-1 and wild type after 6 days of estradiol induction. Scale bars are 1 cm.
(I) Quantification of the root cap length of two independent overexpression lines of each XVE-ANA046-GFP and XVE-NLS-GFP shown in (G). At least 5 roots of each line were quantified. Results are means ± SD. Each line of XVE-ANAC046-GFP is significantly different from line of XVE-NLS-GFP, both in wild type and atg5-1 mutant, but there is no difference between wild type and atg5-1. (t test; ** P < 0.01, **** P < 0.0001).
(J) As indicated by RT-qPCR analysis, a 24 h induction by estradiol caused strong expression of SMB in two independent lines of XVE-TagBFP in wild type and atg5-1 mutant, XVE-NLS-TagBFP in wild type and atg5-1 as control. Results are means ± SD. N = 3 biological replicates. (t test; ** P < 0.01, *** P < 0.001).
(K) CLSM of root tips from 5 DAG seedlings of pH3.3/HTR5::XVE-NLS-TagBFP and pH3.3/HTR5::XVE-SMB-TagBFP in wild type and atg5-1 mutant at different time points after estradiol induction, stained with the PI (magenta). 16 h after estradiol induction, ectopic cell death is detected and indicated by white arrows. PCD of root cap cells is indicated by white asterisks. 40 h after estradiol induction abundant cell death occurred above the root meristem. 60 h after estradiol induction the whole root tip is dead and stained with PI. The signal of TagBFP is shown in green. Scale bars are 50 μm.
See also Figure S3.

