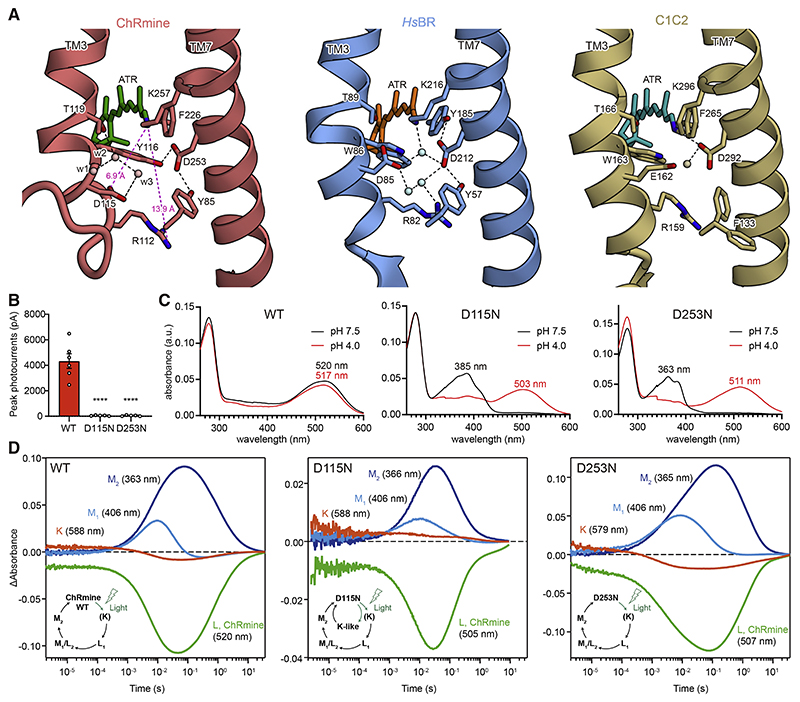
Figure 2. The Schiff base region.
(A) The Schiff base regions of ChRmine (left), HsBR (middle), and C1C2 (right). Spheres and black dashed lines represent water molecules and H-bonds, respectively.
(B) Photocurrent amplitudes of wild-type (WT) ChRmine and two mutants. Mean ± SEM (n = 5–6); one-way ANOVA with Dunnett’s test. ****p < 0.0001.
(C) Absorption spectra of ChRmine WT (left), D115N (middle), and D253N (right) at pH 7.5 (black) and pH 4.0 (red).
(D) Time-series traces of absorption changes for ChRmine WT (left), D115N (middle), and D253N (right) at 363–366 (blue), 406 (cyan), 505–520 (green), and 579– 588 nm (red) probe wavelengths.

