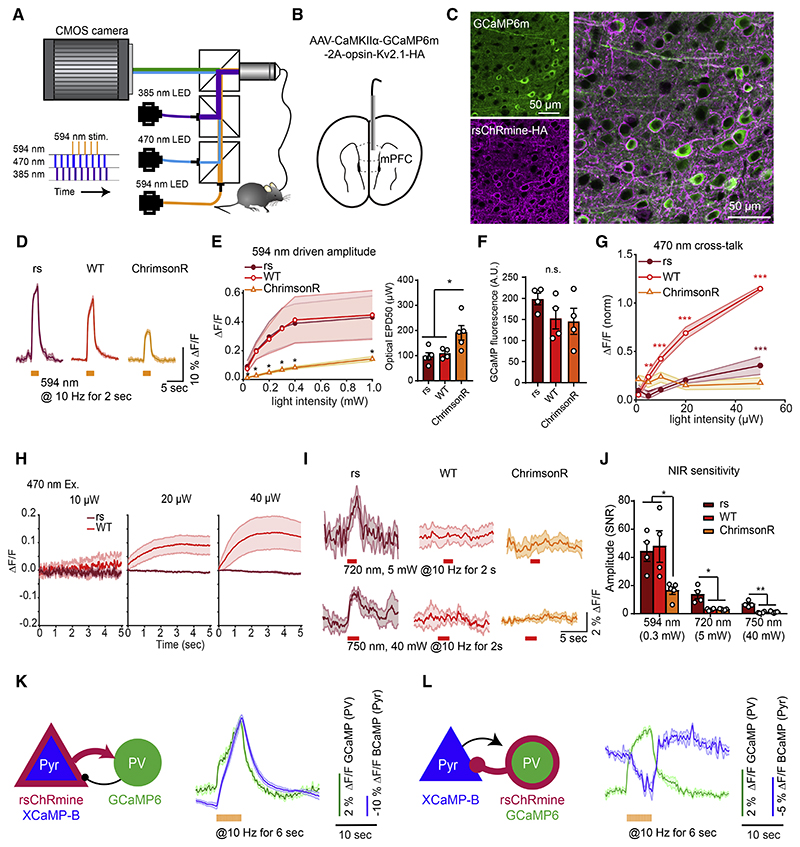
Figure 7. In vivo demonstration of rsChRmine application.
(A) Schematic: FIP rig for simultaneous Ca2+ recording and optogenetic stimulation.
(B) Schematic: virus delivery and fiber placement in mPFC.
(C) Expression of GCaMP6m and rsChRmine in neurons.
(D) GCaMP6m traces in response to 594 nm stimulation in freely moving mice expressing opsins (n = 4 mice, 4 trials per mouse).
(E) Left: mean response to various light powers. Right: EPD50.
(F) Quantification of baseline GCaMP6m fluorescence in rsChRmine, WT ChRmine, and ChrimsonR-expressing mice.
(G) Mean amplitudes evoked at 470 nm normalized to the peak amplitude evoked at 594 nm stimulation for mice expressing each opsin.
(H) GCaMP6m fluorescence at the start of imaging at different 470 nm light powers.
(I) GCaMP6m traces in response to 720 (top) and 750 nm (bottom) stimulation in freely moving mice expressing opsins (n = 4 mice, 4 trials per mouse).
(J) Mean response to 594, 720, and 750 nm stimulation of the indicated opsins.
(K and L) Pyr to PV (K) and PV to Pyr (L) Ca2+ recordings. Left, transgene expression in mPFC PV and CaMKIIα-positive Pyr neurons. Right, representative averaged simultaneous 2-color photometry traces aligned to the start of 594 nm stimulation (green, GCaMP6; blue, XCaMP-B). All data mean (curves) ± SEM (shading around curves); sample size n denotes the number of cells unless otherwise noted. One-way ANOVA with Turkey’s test. *p < 0.05, **p < 0.01, ***p < 0.001, and ****p < 0.0001.

