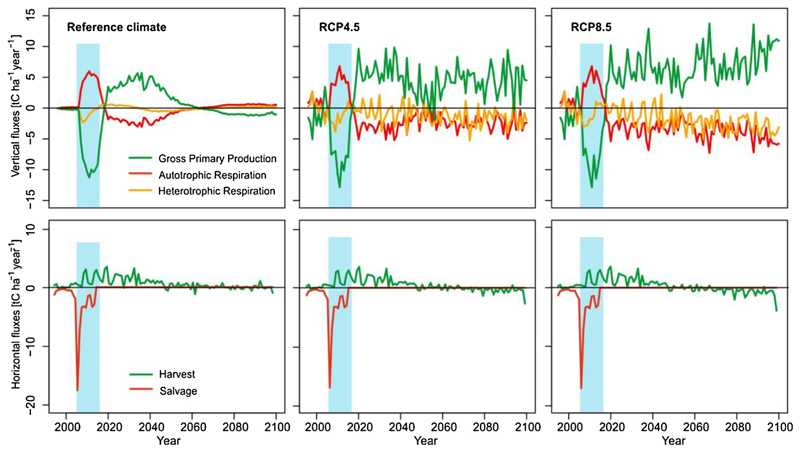
Fig. 6.
Main horizontal and vertical carbon fluxes during the simulation period. Blue rectangle indicates the disturbance episode 2008–2016. The lines show the difference of disturbed trajectories to undisturbed forest development under three climates. In the panels for RCP scenarios, the difference is calculated as (disturbed development under climate change) – (undisturbed development under reference climate); thus the graphs present the combined effect of disturbance and climate change (For interpretation of the references to colour in this figure legend, the reader is referred to the web version of this article.).

