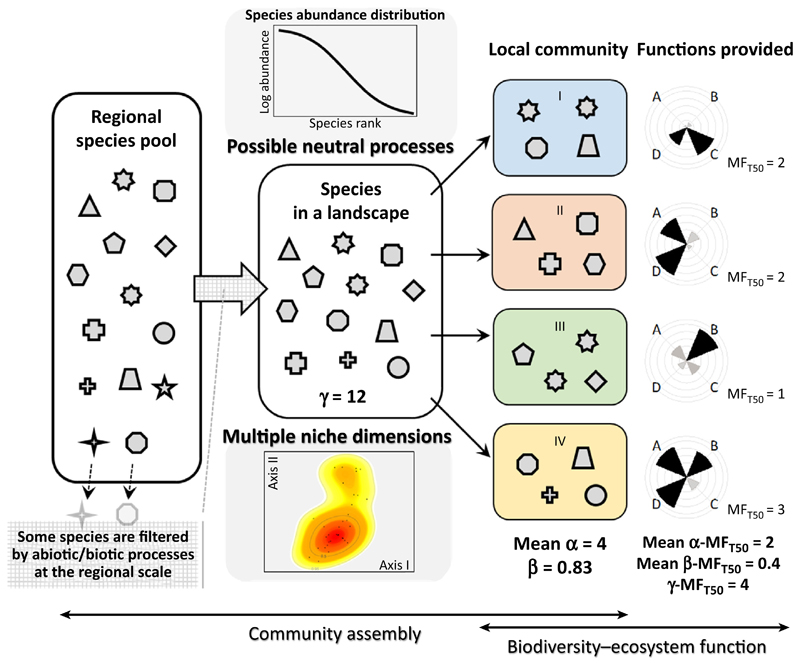
Figure I. Schematic Illustration of Key Processes of Community Assembly and Biodiversity–Ecosystem Functioning Operating at Different Spatial Scales.
Each icon represents different species, and those shown in grey outline are lost from the meta-community of a landscape. The number of species in each local community, and in the landscape containing these communities, constitute α- and γ-diversity, respectively. β-Diversity is calculated based on Sørensen index [33]. To illustrate meta-community structure, the species abundance distribution [101] and kernel density estimation of the trait spectrum [104] are shown. For the latter, contour lines indicate 0.5 and 0.95 quantiles of the occurrence probability of traits. Spatial variation in local environmental conditions is shown by different colors (blue, red, green, and yellow) for the background of local communities [I–IV]. Evaluation of individual functions (A–D) is based on the threshold approach [9]. Levels of individual functions are shown with radial bar diagrams (as shown in Figure I in Box 1). Unlike in Figure I in Box 1, multifunctionality is assessed here at α-, β-, and γ-scales [13]; p-MFT50 values are calculated based on Bray–Curtis distance, and the mean value is shown.

