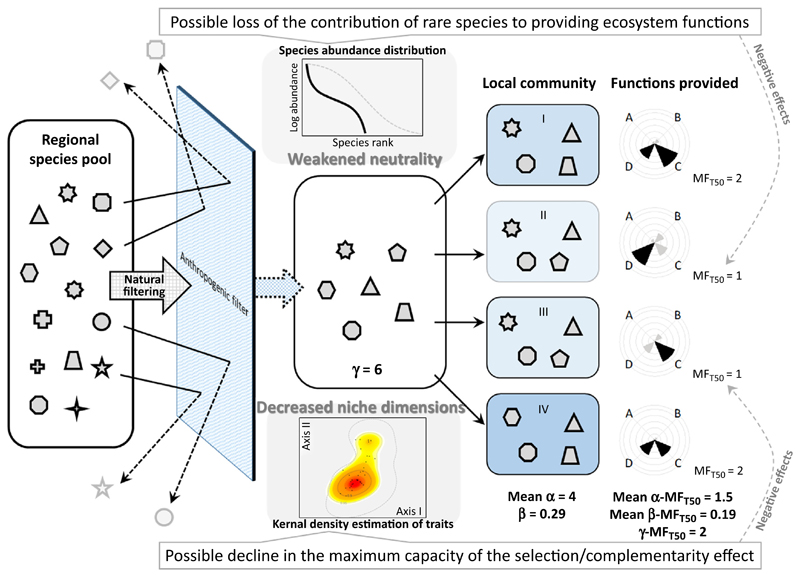
Figure I. Schematic Illustration of Key Processes of Community Assembly and Biodiversity–Ecosystem Functioning, as Altered by Anthropogenic Influences (indicated as the blue-shaded filter).
Environmental conditions (shown by the light-blue background) and species composition (icons) in local communities (I–IV) are similar in functional traits to some extent (because of human-induced environmental homogenization). Explanations of the icons, inset displays, diversity indices, and multifunctionality indices are given in Figure I in Box 2. For species abundance distribution, a possible change is illustrated [there is a shift from the grey dotted curve (shown in Figure I in Box 2) to the black solid curve]. For kernel density estimation of traits, the same dataset [31] as Figure I in Box 2 is used but, instead of those in a natural forest, those homogenized because of forest conversion are shown here (0.95 quantiles of occurrence probability in Figure I in Box 2 is shown with a grey dotted line).

