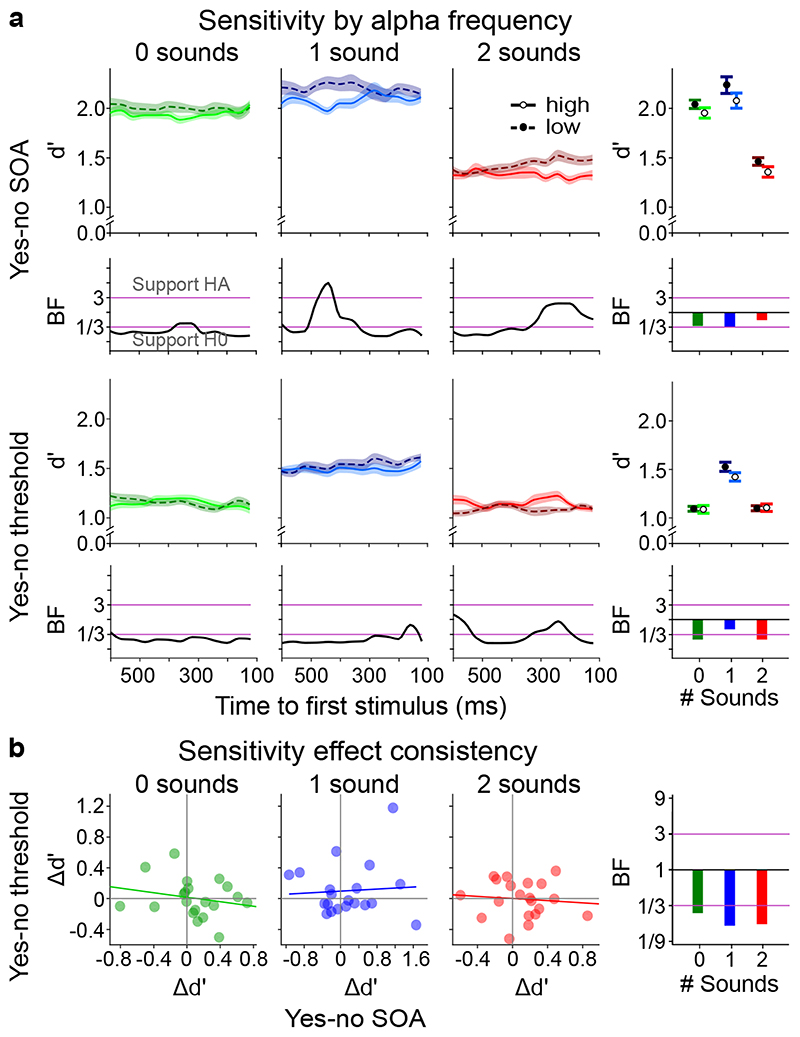
Figure 2. The influence of pre-stimulus alpha frequency on d’ (cf. Supplementary Tables 5, 7).
a, Perceptual sensitivity (across-participants’ mean ± 1 within-subject SEM) is shown for low (1st tercile, dashed) and high (3rd tercile, solid) pre-stimulus alpha frequency across pre-stimulus time for the 2 experimental designs (rows: (i) yes-no, (ii) ‘yes-no threshold’) x 3 sensory contexts (columns: no sound, one sound, two sounds). The right most column shows results where instantaneous frequency estimates were averaged over time. We observed no significant effect of pre-stimulus alpha frequency on perceptual sensitivity in any of the experiments (all p > 0.05; columns 1-3, two-sided cluster randomization tests, column 4, paired t-tests). Bayes factors (BF) indexing the evidence for HA relative to H0 are shown on a log10-scaled ordinate. Purple lines indicate thresholds for at least moderate evidence favouring H0 (< 1/3) or Ha (> 3)77. b, Within subject consistency of perceptual sensitivity relationship with alpha frequency over tasks. The difference in sensitivity between low and high alpha frequency (Δd’ = d’low – d’high) was not significantly correlated between the ‘yes-no SOA’ and the ‘yes-no threshold’ experiment over participants for any sensory context. SEM, Standard error of the mean.

