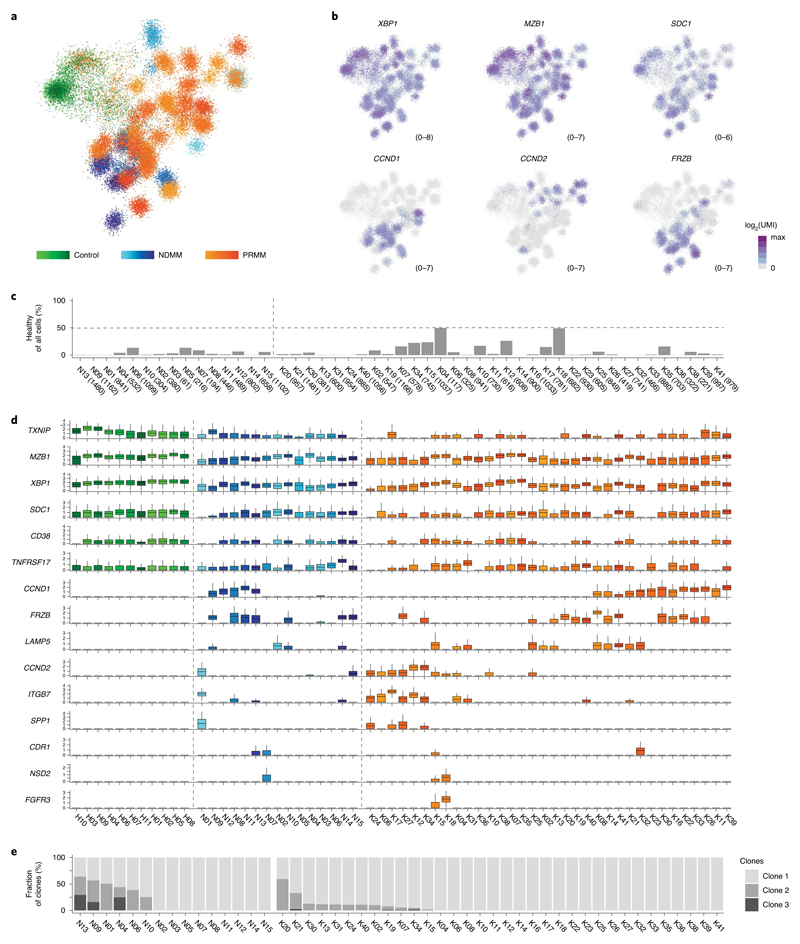
Fig. 1. Single-cell atlas of PCs derived from NDMM and PRMM patients.
a, The 2D projection showing expression profiles of 51,297 QC-positive single BM PCs derived from 60 patients: 11 controls, 15 NDMM and 34 PRMM patients. b, The 2D projection of a selected set of key PC genes and main MM driver genes over the metacell model. c, Barplot depicting percentage of seemingly healthy PCs within total collected PCs among 15 individual NDMM (N) and 34 PRMM (K) patients, with the total number of collected PCs from each patient in the brackets of the labels on the x axis. d, Boxplots showing normalized expression (Methods) of canonical PC genes and common MM driver genes in 11 controls (H), and 15 NDMM (N) and 34 PRMM (K) individual patients. The center line represents the median, the box limits the upper and lower quartiles, and the whiskers 1.5× the interquartile range. e, Barplot depicting malignant PC clonality in individual NDMM and PRMM patients.

