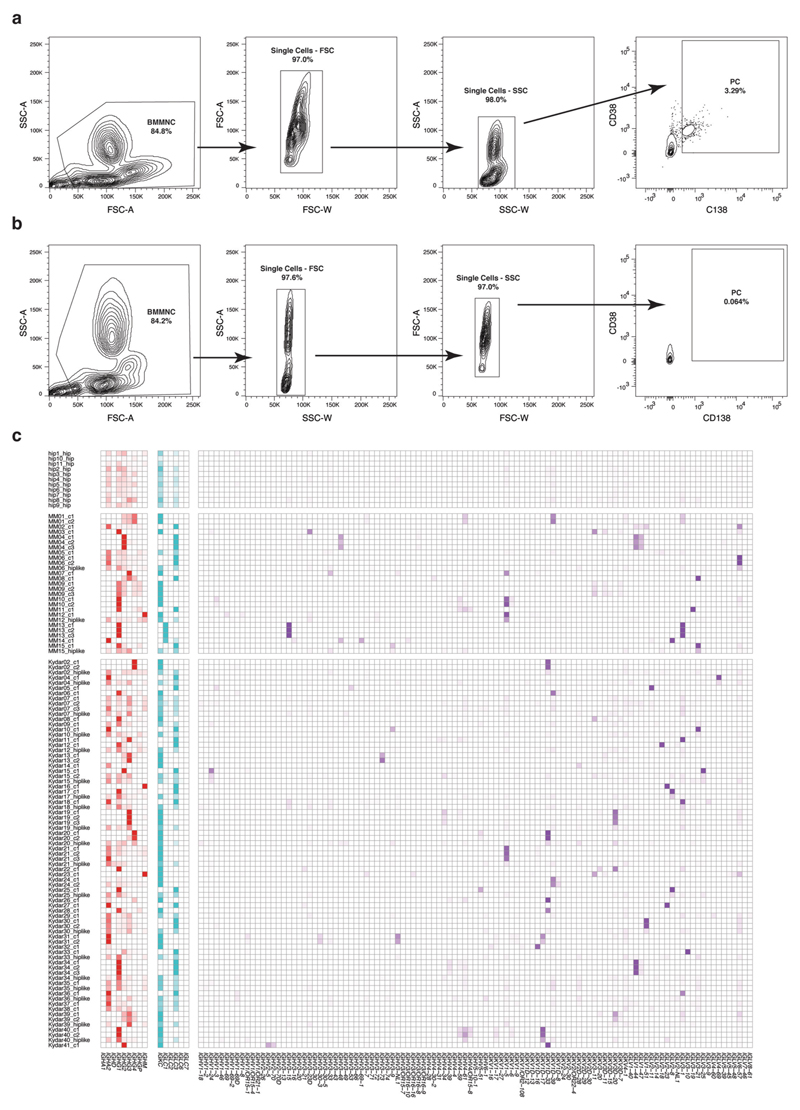
Extended Data Fig. 7. Longitudinal data collection of PRMM patients.
a, Representative flow cytometry plots showing sorting strategy (CD38+CD138+) for post treatment patients’ plasma cells after doublet exclusion, same as in Extended Data Fig. 1a, but for the samples from patient KYDAR 10 after 4 cycles DARA-KDR treatment. b, Same as in panel a, but for patient KYDAR 10 after 10 cycles DARA-KDR treatment. c, Heat map depicting the relative frequency of the immunoglobulin sequences for each clone (including 11 control donor and 15 newly diagnosed patients); left, bottom, immunoglobulin heavy chain constant region (IGHC); middle, immunoglobulin light chain constant region (IGKC and IGLC); right, immunoglobulin light chain variable region (IGKV and IGLV).

