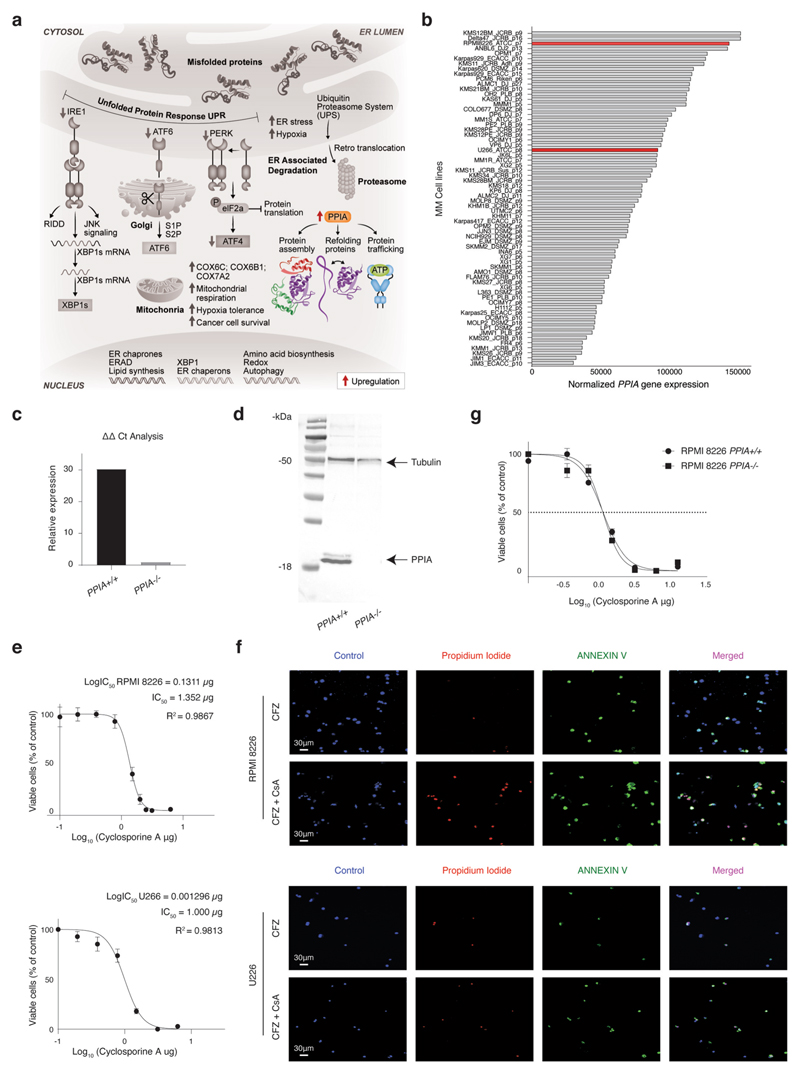
Extended Data Fig. 9. CsA potentiates Carfilzomib and induced cell death in myeloma cell lines.
a, Graphical illustration of PRMM non-responder resistant pathway, highlighting PPIA. b, Bar plots showing normalized RNAseq PPIA gene transcription in MM cell lines, highlighted in red lines − RPMI-8226 and U266 cell lines (Methods). c, Barplot showing PPIA mRNA levels measured by qPCR in RPMI-8226 PPIA+/+ and PPIA-/-. d, Western blot of PPIA protein levels in RPMI-8226 PPIA+/+ and PPIA-/- cell lines. Shown are cropped western blots of PPIA protein levels in RPMI-8226 PPIA+/+ and PPIA-/- cell lines (tubulin is used as control). Full image can be found in raw data section. Western Blot experiment was conducted once with 3 successful replicates per cell line group. e, Dose-response curves to determine the half maximal inhibitory concentrations (IC50) of CsA in RPMI-8226 and U266 cell lines (Methods). The dose-response curves and IC50 values were determined by a non-linear regression fit. Results are shown as the mean±SEM (Standard Error of the Mean) of 3 independent experiments. f, Immunofluorescence staining of RPMI 8226 (upper) and U266 (lower) cell lines post treatment with Carfilzomib or in combination with CsA for 48h. DAPI (Blue) staining for control live cells, Propidium Iodide (Red) staining for late apoptosis (death), FITC (Green) staining for early apoptosis, and merged gate showing all staining. Representative images from two independent experiments are shown. g, Dose-response curves to determine the half maximal inhibitory concentrations (IC50) of CsA in RPMI-8226 PPIA+/+ and PPIA-/- cell lines (Methods). Results are shown as the mean±SEM (Standard Error of the Mean) of 3 independent experiments.

