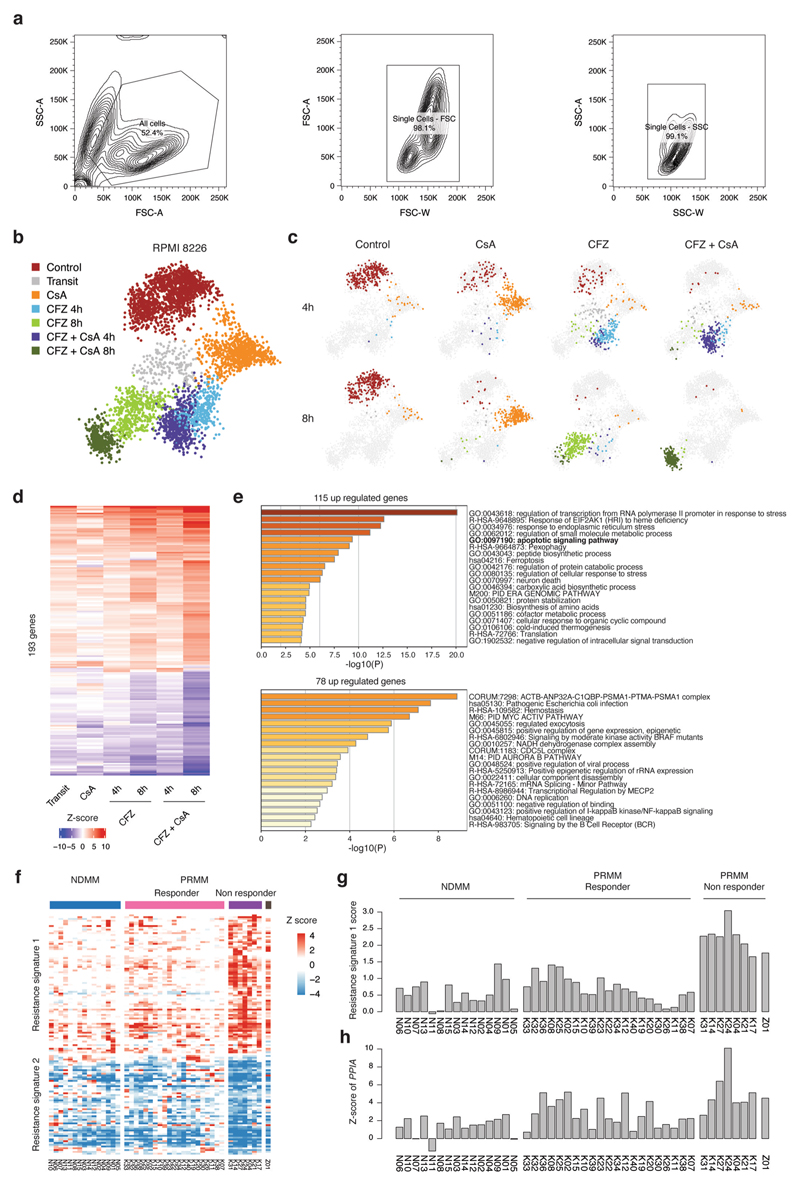
Extended Data Fig. 10. Cyclosporin A, known inhibitor for PPIA shown synergistic effect with the proteasome inhibitor carfilzomib.
a, Representative flow cytometry plots showing sorting strategy for single RPMI-8226 cells. b, 2D projection showing metacell analysis of scRNA-seq of RPMI-8226 cells during CsA, CFZ, and CFZ+CsA treatment at 4 h and 8 h. Different cell states are indicated by colors. c, 2D projection showing the distribution of the cells (down sampled to 299 cells) in each sample over the metacell map in panel b. d, heatmap showing z-score of differentially expressed genes in each cell state. e, gene ontology enrichment of the 115 up regulated genes and 78 down regulated genes. f, Heatmap depicting the z-score of resistance signature 1 and 2 (Fig. 4a) genes in 15 NDMM, 21 PRMM responder, and 7 PRMM non-responder patients, together with ex-vivo cells of one highly resistant PRMM patient Z01. g, barplot showing scores of resistance signature 1 in 15 NDMM, 21 PRMM responder, and 7 PRMM non-responder patients, together with one resistant PRMM patient Z01. h, barplot showing Z-scores of PPIA expression in the same NDMM and PRMM patients in panel g, together with the resistant PRMM patient Z01.

