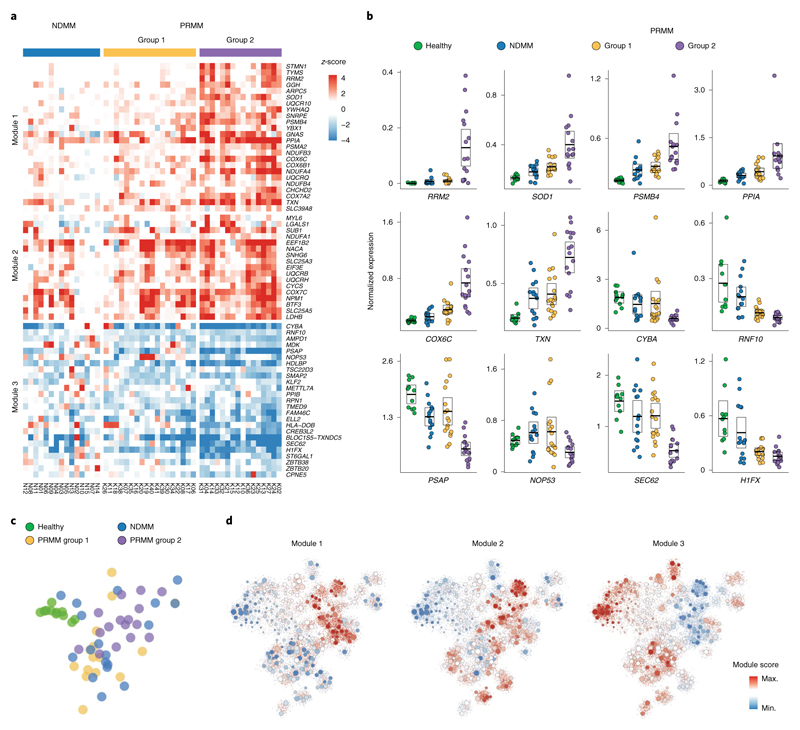
Fig. 2. New MM gene modules define subsets of PRMM patients.
a, Heatmap depicting the z-score of 66 differential genes with an FDA-adjusted P <0.05 (statistical test, see Methods) between the malignant PCs of NDMM and PRMM patients. b, Dot plots showing average expression of a selected set of highly differential genes between NDMM and PRMM patients, in four different patient groups: healthy, NDMM patients, PRMM group 1 and PRMM group 2. The center line represents the mean, the box limits the 95% confidence intervals, and the points all the data. c, The 2D projection of the same patient groups in b over the metacell model. Individual patients are located in the mean coordinates of their corresponding cells. d, The 2D projection of gene module scores of the three gene modules in a over the metacell model. Individual cells are represented by small dots, whereas metacells are represented by bigger dots proportional to the cell number of each metacell.

