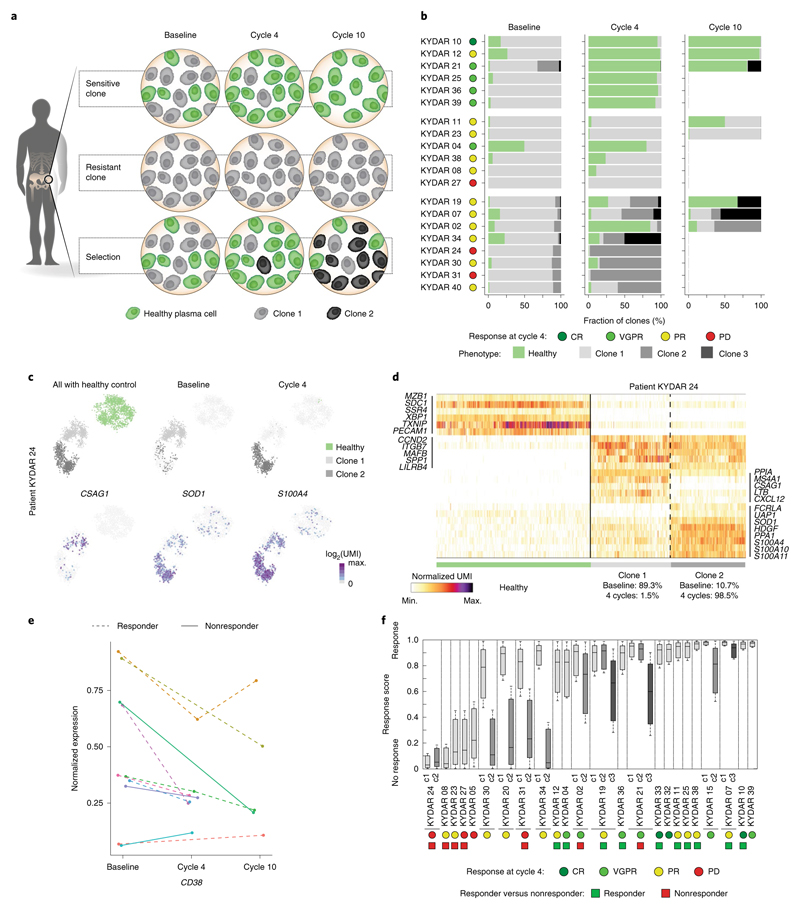
Fig. 5. Longitudinal single-cell analysis of MM patients pre- and post-treatment.
a, Graphical illustration of clonal evolution and dynamics of malignant PCs into three main trajectories during DARA-KDR treatment: sensitive, resistant and selection. b, Barplots depicting longitudinal malignant PC clonality in pre-treatment (baseline) and post-treatment (cycle 4, 3 months; cycle 10, 9 months) of individual PRMM patients. Healthy PCs are shown in green, whereas different clones of malignant PCs are shown in different shades of gray. Patient outcome at 4 months is indicated on the right of the patient labels. c, Top: 2D projection of malignant PCs of patient KYDAR 24, including healthy PCs as a reference, highlighting all cells (left), cells collected from baseline (middle) and cells collected from cycle 4 (right). The color of the cells represents healthy PCs, and malignant clones 1 and 2. Bottom: 2D projection of expression of a selected set of differential genes over the metacell model. d, Heatmap showing expression of selected differential genes between the two malignant PC clones of patient KYDAR 24, with healthy PCs as a reference. e, The dynamics of CD38 expression in individual patients during DARA−KRD treatment. f, Boxplot showing the response scores of individual cells of each malignant PC clone in 24 individual patients using a shallow neural network classifier predicting the response to treatment after 4 months. The center line represents the median, the box limits the upper and lower quartiles, and the whiskers 1.5× the interquartile range.

